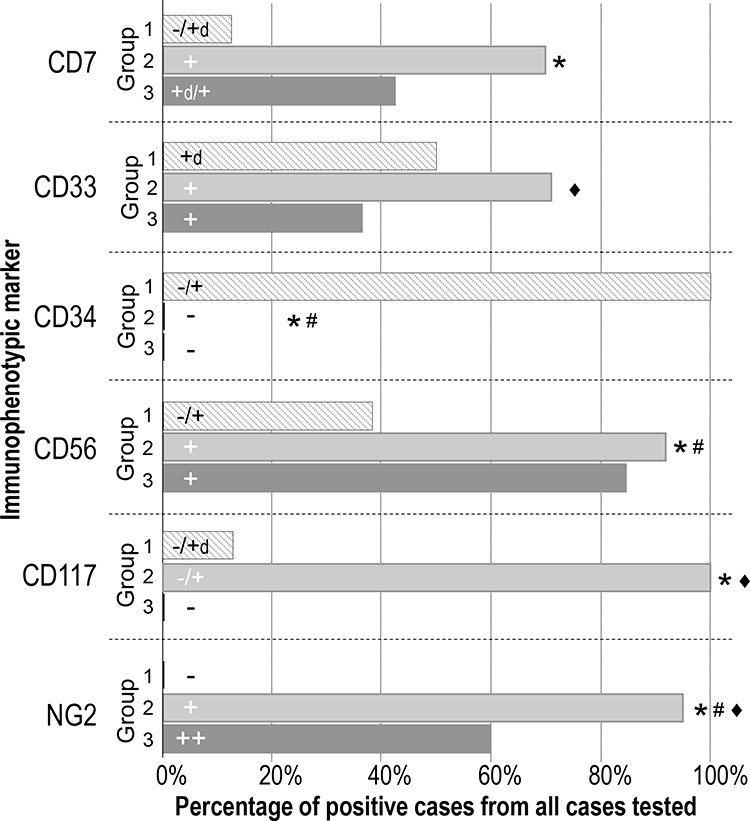
Figure 2. Immunophenotypic differences observed for individual markers on neoplastic pDC from PBDCN patients classified into the three different maturation-associated groups defined in this study.

Only those markers that showed statistically significant differences -CD7, CD33, CD34, CD56, CD117 and NG2- among the three maturation-associated groups of BPDC neoplasms are shown; the percentage of positive cases and the pattern of expression (intensity) observed for the above listed markers are represented as bars for each group of patients. The correspondence between MFI values and the different categories of intensity of expression defined for the individual markers is shown in Supplementary Table 2. Statistically significant differences were found between *Group 1 vs. Group 2, #Group 1 vs. Group 3 and ♦Group 2 vs. Group 3.
