
Figure 2. Multi-dimensional scaling (MDS) plot of circulating small RNAs. The plotMDS function of edgeR was used to examine relationship between samples of circulating miRNA.
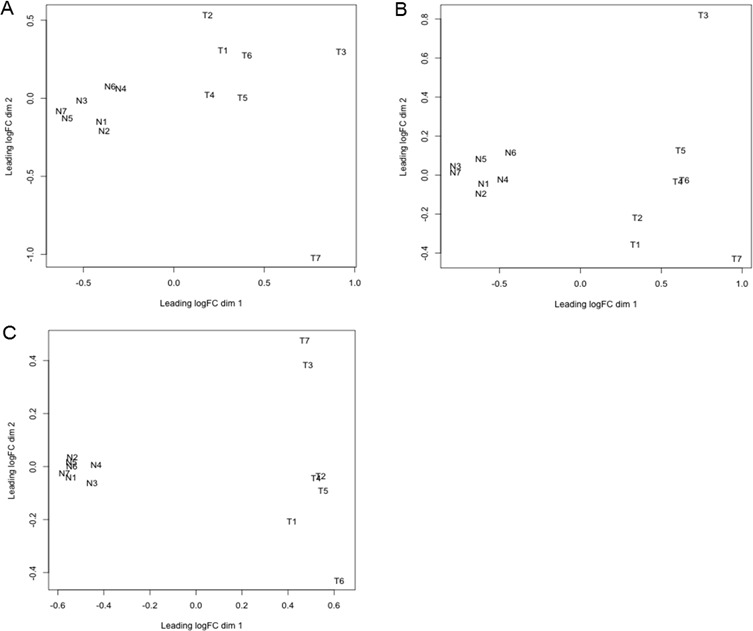
A., tRNA-derived small RNA B., and YRNA-derived small RNA C.. This function clusters the small RNA samples according to two automatically determined dimensions (dim 1 and 2). Dimension 1 represents the cancer effect, while dimension 2 represents the homogeneity between biological replicates. The analyzed small RNA samples are from normal controls (N1-7), and cancer patients (T1-7). “logFC” is log fold change.