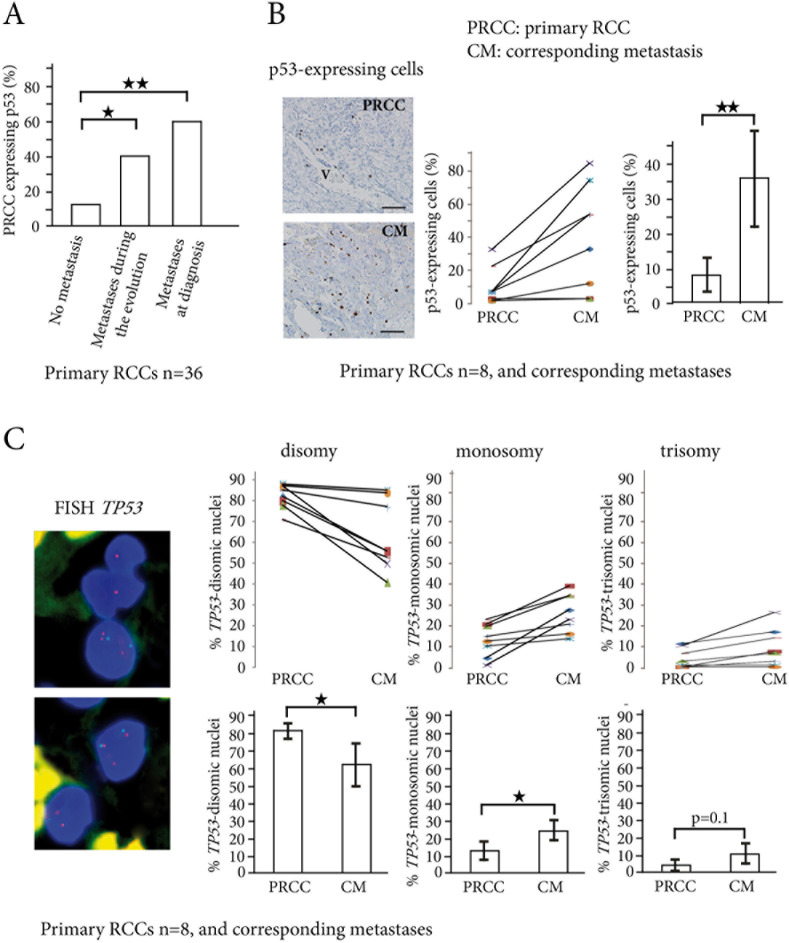
Figure 1. p53-expressing tumor cells and TP53 copy number abnormalities in primary RCCs and corresponding metastases.
A. In the 36 primary RCCs, the percentage of tumors expressing p53 (threshold >1% p53-positive cells) significantly increases from the primary RCCs (PRCC) with no metastasis to the PRCCs with metastases during evolution or at diagnosis. B. p53-expressing cells are found around vessels (V) in primary RCC, and are scattered in the corresponding lung metastasis. Indirect immunoperoxydase, bar =50μm. In 8 patients with biopsy samples of the primary RCCs (PRCC) and their corresponding metastases (CM), the percentage of p53-expressing cells significantly increases in the metastases. C. TP53 gene copy number abnormalities are assessed by FISH in the same 8 patients, with TP53 gene labeled in red and chromosome 17 centromere in green. Nuclei are colored in blue by DAPI. The upper panel shows one trisomic nucleus (three red spots) and two monosomic nuclei (one red spot in each) for TP53 gene. The lower panel shows one trisomic cell and one disomic cell. Counts of TP53 gene copy numbers show a significant decrease in the percentage of disomic cells in the metastases, while the percentage of monosomic cells significantly increases. *p < 0.05, **p < 0.01.

