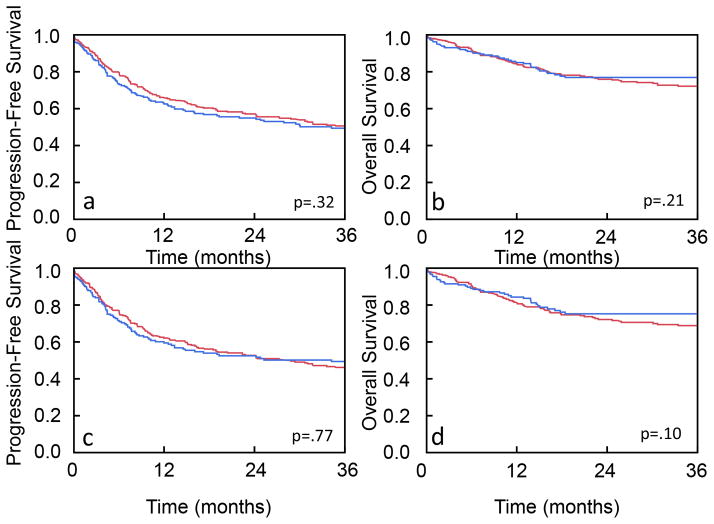
Figure 1. Kaplan-Meier analysis of outcomes in black and white patients.
(a) PFS and (b) OS for all HNSCC patients treated with radiotherapy. (c) PFS and (d) OS for Stage III–IV HNSCC patients treated with radiotherapy. Blue line represents white patients. Red line represents black patents. The logrank test was used to assess for differences in OS and PFS.

