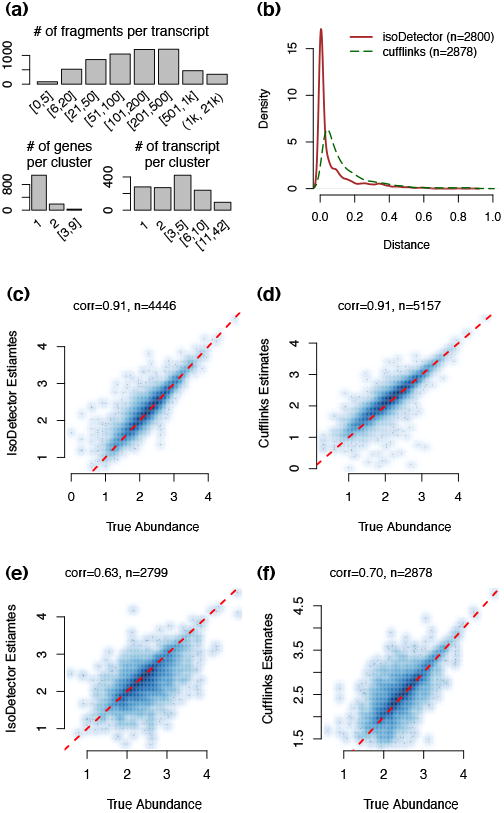
Figure 2.

(a) A summary of the RNA-seq data and annotation of the simulated case sample. (d) Density curves of the distance between each de novo transcript and its closest transcript from transcriptome annotation. The distance is defined as the ratio of the number of unmatched base pairs over the total number of base pairs covered by either isoform. A base pair is “matched” if it corresponds to an exon or intron location for both isoforms. (c-d) Comparison of true transcript abundance vs. estimates from IsoDetector or Cufflinks when we use known isoform annotation. Both X and Y-axes are in log10 scale. “n” is the number of transcripts with status “OK” for either IsoDetector or Cufflinks. (e-f) Comparison of true transcript abundance vs. estimates from IsoDetector or Cufflinks when we do not use any isoform annotation.
