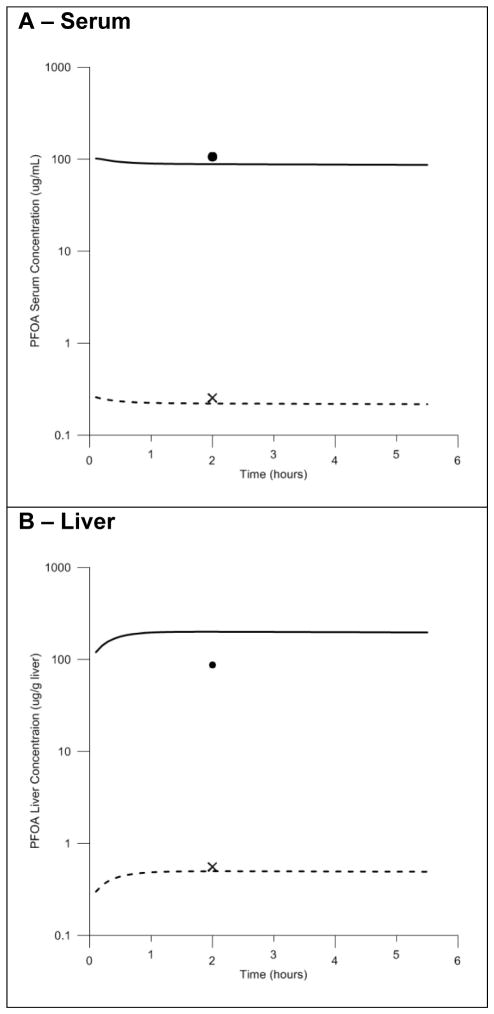
Figure 4. Model evaluation with time course data resulting from IV exposure in the male rat.
Comparisons of the predicted and measured serum (4A) and liver (4B) concentrations resulting from high (16.0 mg/kg body weight) and low (0.041 mg/kg body weight) dose IV exposures. High exposure dose data shown as solid line (predicted) and black circle (measured). Low exposure dose data shown as dashed line (predicted) and black cross (measured).

