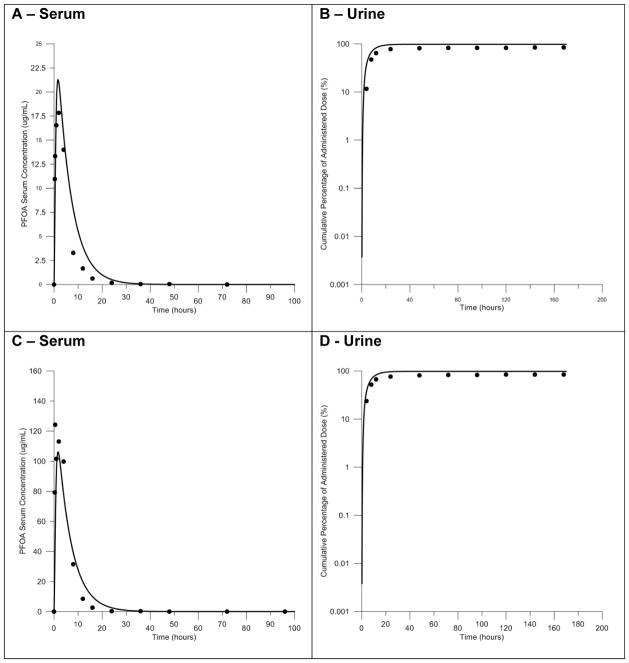
Figure 7. Model evaluation with time course data resulting from oral gavage exposure in the female rat.
Comparisons of the predicted and measured serum concentrations and the cumulative percent of the dose in the urine resulting from oral exposure to 5.0 (panels A and B) or 25.0 (panels C and D) mg/kg body weight PFOA. Predictions shown as solid lines, measured data shown as black circles.

