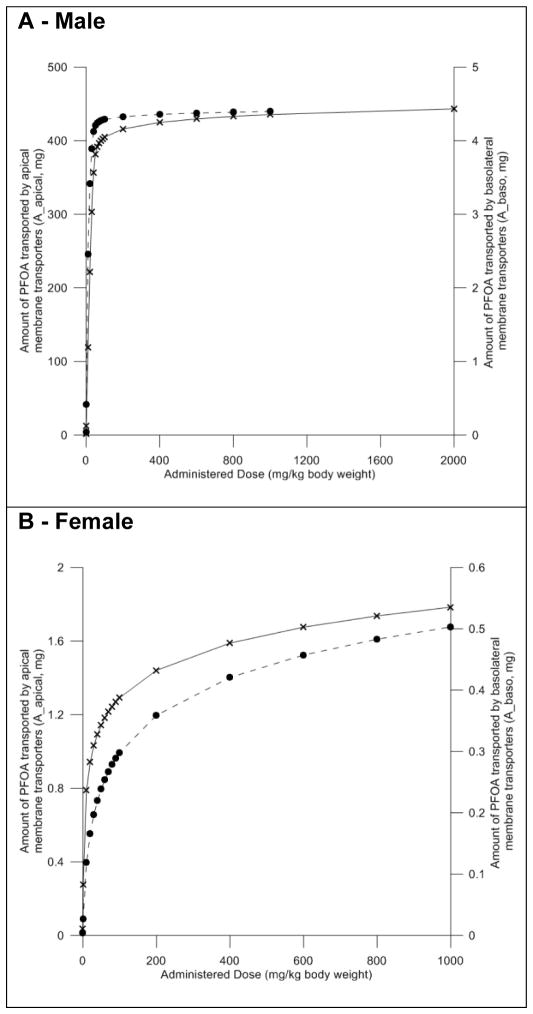
Figure 8. Evaluation of the impact of dose on transporter activity in the male and female rat models.
Model predicted mass of PFOA transported by basolateral (dashed line – right Y-axis) and apical (solid line – left y-axis) membrane transporters. Black circles and crosses represent actual data points. Male data shown in panel A, female data shown in panel B.

