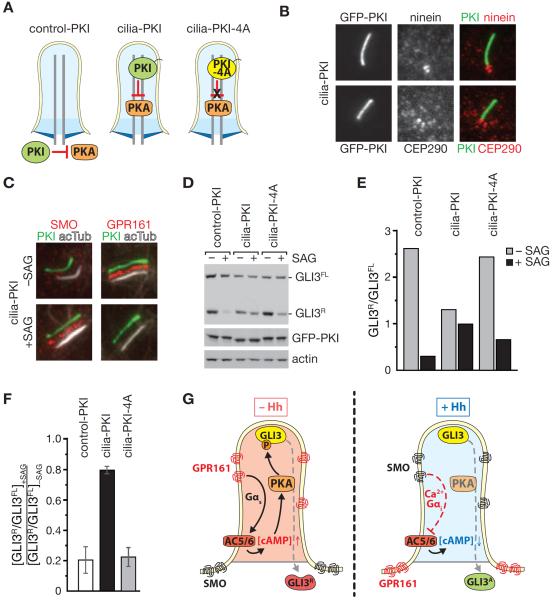
Figure 4. Cilium-specific inhibition of PKA perturbs GLI3 processing during Hedgehog signaling.
(A) Diagrams of cell lines expressing cilia-PKI to inhibit PKA activity within primary cilia, the non-inhibiting mutant cilia-PKA-4A, and control-PKI expressed in the cytosol.
(B) Ciliated IMCD3-[cilia-PKI] cells stained for ninein and CEP290. Cilia-PKI was detected by GFP fluorescence. Scale bar: 1 μm. (c–f) Ciliated cells were treated with 200 mM SAG or vehicle control for 16 h.
(C) IMCD3-[cilia-PKI] cells were stained for acetylated Tubulin, GPR161 or SMO. Channels were shifted to aid visualization (see Figure S3 for individual channels and control cell lines).
(D–E) Indicated cell lines were analyzed by immunoblotting for GLI3, GFP and actin (D), the GLI3R and GLI3FL signals were quantified by densitometry (ImageJ) and the GLI3R/GLI3FL ratios plotted in (E).
(F) The effect of SAG addition on the GLI3R/GLI3FL ratios was measured. The average from 3 independent experiments is shown. Error bars depict standard deviations (n = 3).
(G) Model depicting the ciliary AC/cAMP/PKA signaling axis during Hedgehog signaling. See text for details. See also Figure S3.

