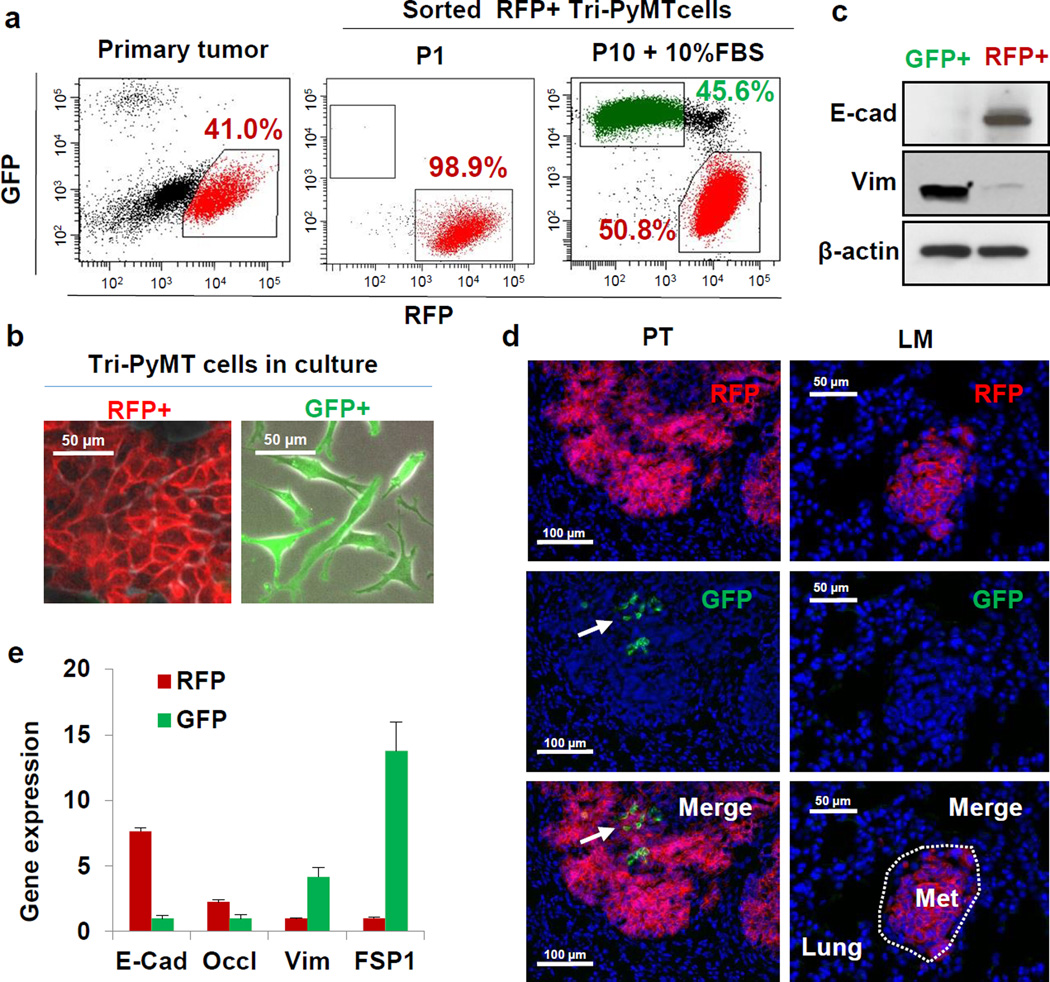
Figure 2. The EMT lineage tracing system reports EMT in tumor cells with high fidelity.
a, Scatter plots from flow cytometry analysis of Tri-PyMT primary tumor cells, depicting GFP+ and RFP+ populations in the primary tumor immediately after sorting of RFP+ cells (P1), and after 10 passages in culture with 10% FBS (P10+10%FBS). Numbers indicate the percentage of RFP+ and GFP+ cells in the total population.
b, Phase contrast/fluorescent overlay image of Tri-PyMT cells in culture.
c, Western blot of sorted RFP+ and GFP+ Tri-PyMT cells for E-cadherin, vimentin and β-actin as a loading control. Representative of 2 individual experiments. For gel source data, see Supplementary Figure 1.
d, Representative imaging of GFP+ and RFP+ tumor cells in primary tumors (PT) and lung metastases (LM) in the orthotopic model (n=8 mice). Arrow indicates scattered GFP+EMT tumor cells in the primary tumor.
e, Q-RT-PCR analysis of relative expression of EMT markers in RFP+ and GFP+ cells sorted from orthotopic Tri-PyMT primary tumors. GAPDH served as the internal control. Data are reported as mean ± SEM, n=4 primary tumors.

