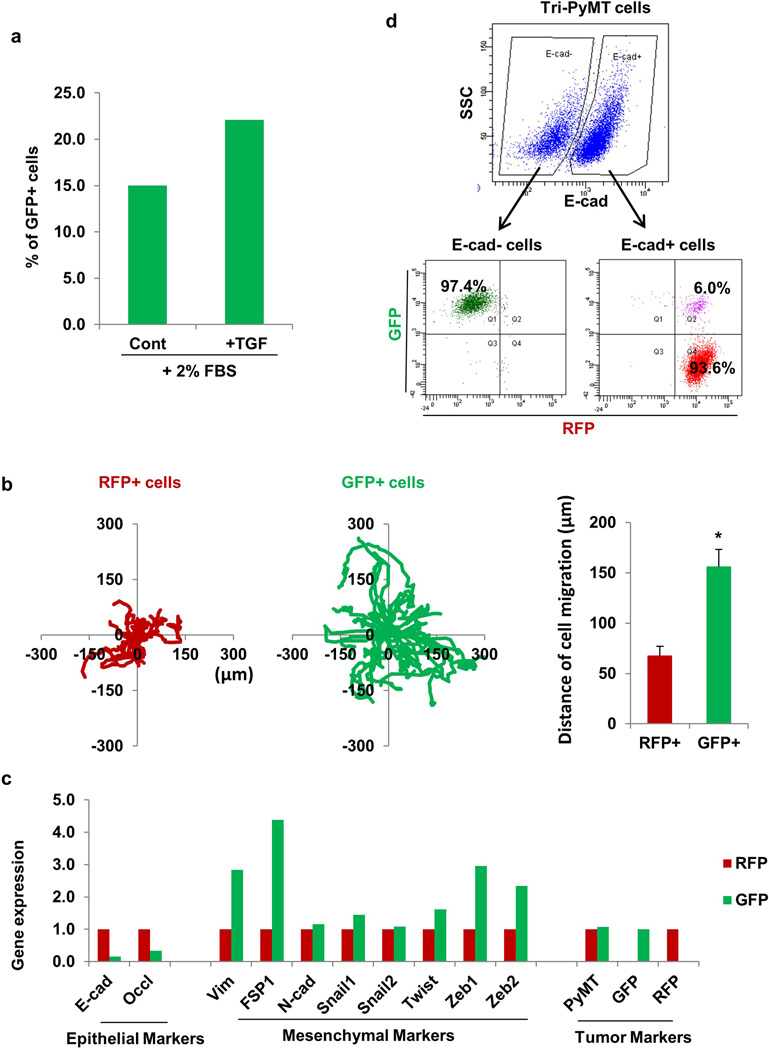
Extended Data Figure 4. Characterization of Tri-PyMT cells.
a, EMT of Tri-PyMT cells with TGF. RFP+ Tri-PyMT cells were sorted by flow cytometry and cultured in medium containing 2% FBS with or without TGF-β1 (2ng/mL) for 3 days. Plot shows quantification of the percentage of GFP+ cells analyzed by flow cytometry (n=2 biological replicates).
b, Cell migration assay of Tri-PyMT cells. The tracing plots show the movement of individual RFP+ and GFP+ cells in 10 hours of live imaging. Quantification plot (right panel) showed the average distance that RFP+ and GFP+ cells have moved during the time frame (n>20, *p<0.01).
c, Relative expression of epithelial, mesenchymal, and tumor markers in sorted RFP+ and GFP+ Tri-PyMT cells as determined by Q-RT-PCR with GAPDH as the internal control. n=2 individual experiments.
d, EMT of Tri-PyMT cells is reported by fluorescent marker switch. Flow cytometry plot shows E-cadherin- (E-Cad-) and E-cadherin+ (E-Cad+) subpopulations of Tri-PyMT cells (upper panel). Of the E-Cad- and E-Cad+ subsets, the populations were further dissected according to innate fluorescence (lower panel). Numbers indicate the percentage of GFP+, RFP+, or transitioning (Q2) cells in the parental E-Cad- or E-Cad+ subsets, respectively.

