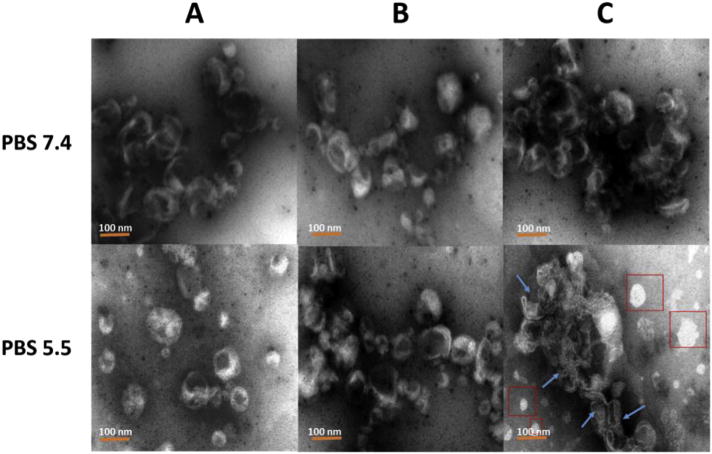
Fig. 5.

TEM images of the three LPK NPs in both pH 7.4 and pH 5.5 PBS buffer. (A) LPK− NPs, (B) LPK+ NPs, (C) LPKpH NPs. In contrast to other two NPs, LPKpH NP underwent significant morphology change after low pH treatment. The blue arrows show degraded lipid layer, and red boxes show released PK NPs. The scale bars represent 100 nm. (For interpretation of the references to colour in this figure legend, the reader is referred to the web version of this article.)
