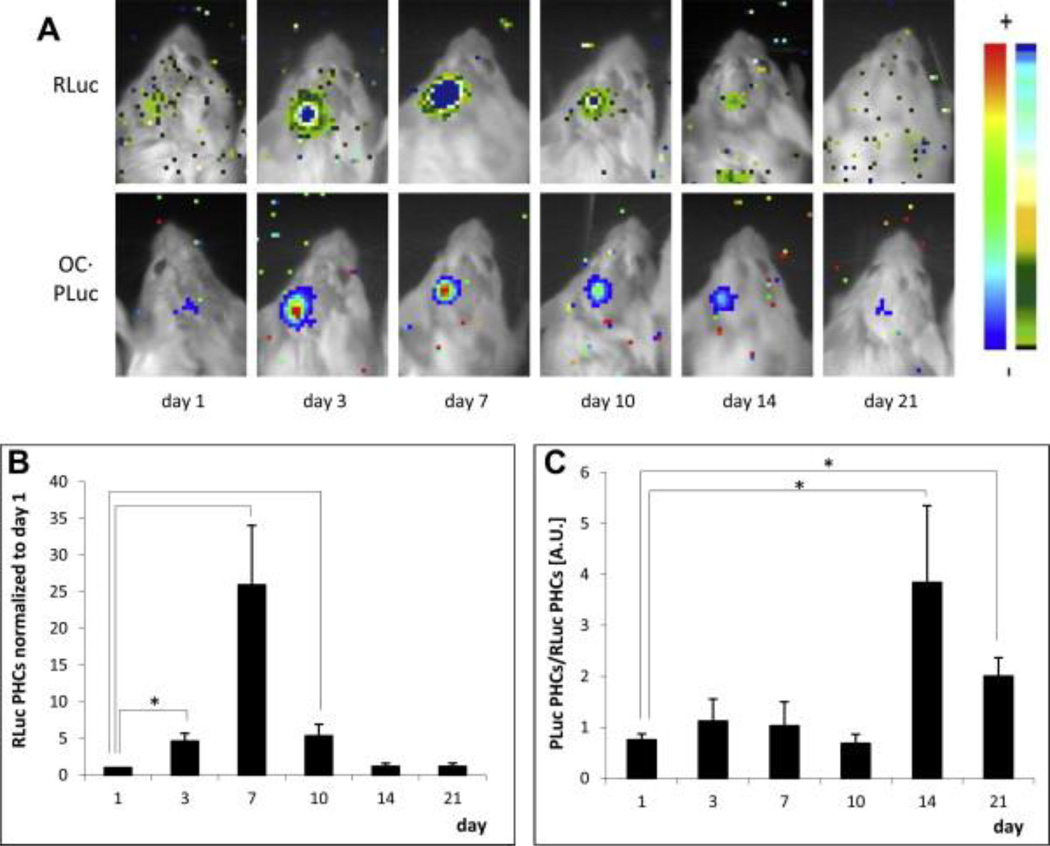
Figure 2.
Bioluminescence imaging of Renilla reniformis (RLuc) luciferase under transcriptional control of the cytomegalovirus promoter and PLuc under transcriptional control of the human osteocalcin promoter in transduced human adipose-derived mesenchymal stem cells. Cells were seeded within fibrin matrices and implanted in a 3 mm calvarial defect in SCID mice. A) Representative bioluminescence images showing RLuc (top row) and PLuc (bottom row) intensities. Color bars indicate light intensities from RLuc (black=low; blue=high) and PLuc (blue=low; red=high) B) Quantification of the bioluminescence signal under the constitutive promoter RLuc normalized to day 1. C) Quantification of the bioluminescence signal under the osteocalcin promoter PLuc normalized to RLuc. While osteocalcin signal increases at 2 and 3 weeks, the total amount of cell signal decreases after week one in immunocompromised mice. Adapted from Vila et al [66].

