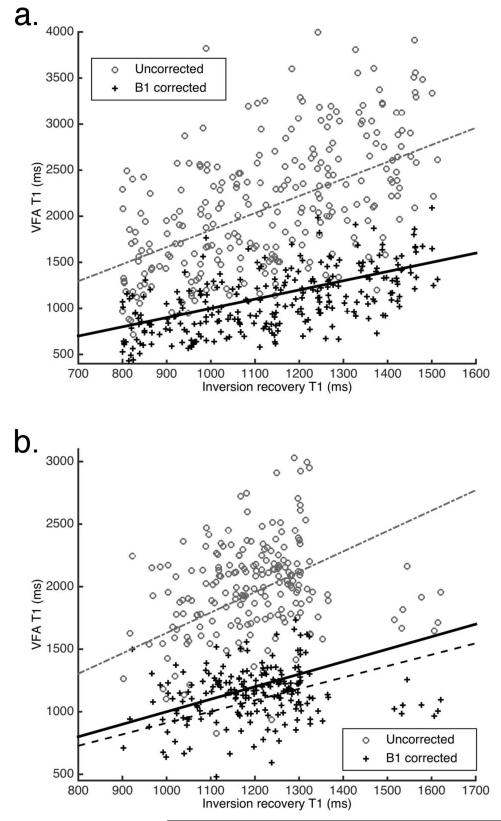
Figure 6.
Scatter-plots of VFA T1 data (before and after B1 correction) vs. inversion recovery T1 data. Dotted lines correspond to linear fits to data, solid line is the line of equality (lines overlap in a). Parameters for the fits are included in Table 2 (a. case 1, b. case 2)

