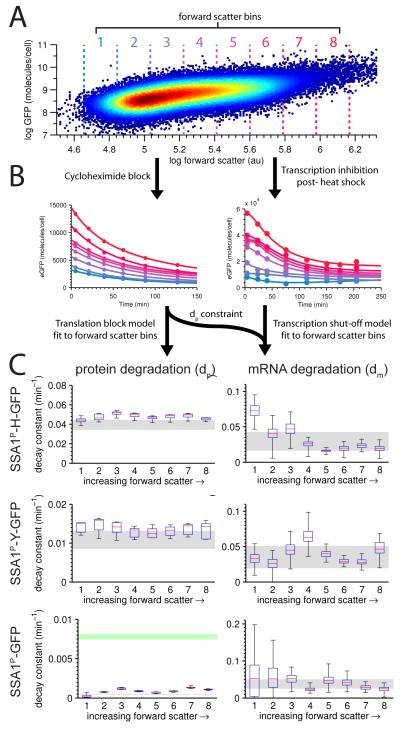
Figure 2. RNA and protein degradation rates conditioned on cell size.
A Single-cell SSA1P-Y-GFP expression measured by flow cytometry in one replicate (37 ° C) plotted against forward scatter. The same forward scatter bin parameters were used across all experiments. B Protein decay constants were obtained by tracking bin-specific (color-coded to match A, above) decay in the presence of the translation-blocking agent cycloheximide. RNA decay constants were obtained by tracking transcriptionally-mediated inhibition of SSA1 expression after heat shock, and constrained by the protein decay rate. C Estimated protein (left column) and RNA (right column) decay constants for each forward scatter bin. Red lines are median rate constant estimates, blue lines are 25th and 75th percentiles, and whiskers mark the full range. Gray regions indicate decay constants estimated on the bulk data rather than binned by forward scatter (99% CI). For SSA1P-GFP protein degradation (bottom left), the green region represents the 99% CI for expected degradation assuming dilution from growth alone. See also Figure S2.

