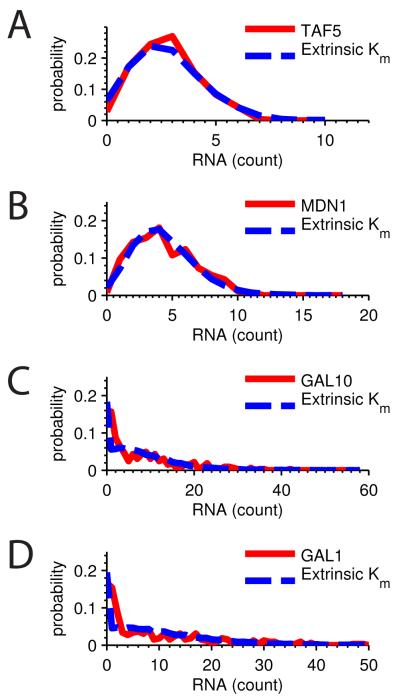
Figure 6. Extrinsic model consistent with RNA count distributions.
All figures are RNA count distributions from Gandhi et al. (Gandhi et al., 2011). Extrinsic Km model distributions (blue) were determined from the first and second moments and plotted against experimental data (red). Distributions are A TAF5 (μ=σ2), B MDN1 (μ=σ2), C GAL10 (μ=σ2), and D GAL1 (μ=σ2).

