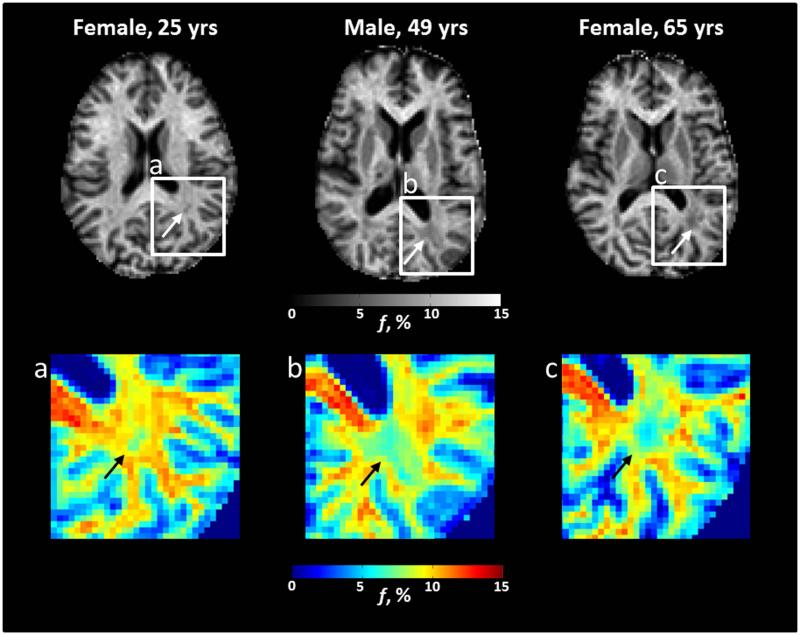
Figure 6.
Axial bound-pool fraction maps (f maps) from participants with Fabry disease. There is evidence in the left posterior white matter for a gradual decrease in myelin density (white arrows) with age that may be more apparent on corresponding color maps (a-c, black arrows). Specifically, there is a trend from yellow/red towards light and dark blue with increasing age.

