
Figure 2. Fatty acid chromatogram of control (left) and ethanol treated (right) liver (A) and pancreas (B) of rats treated for 6 weeks with ethanol diet.
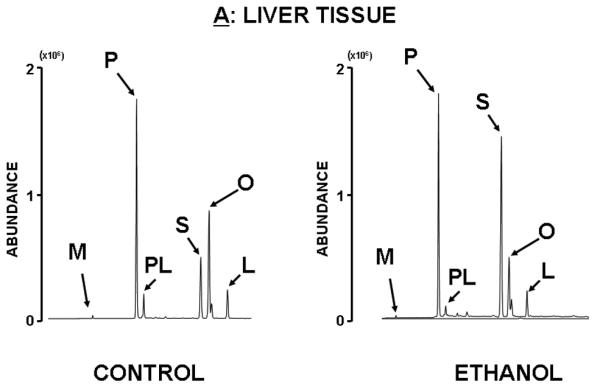
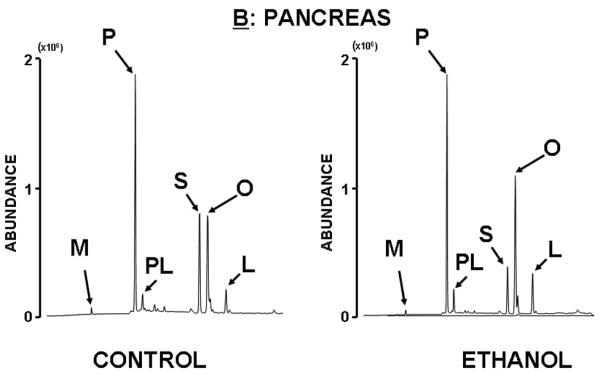
There are discernible changes in fatty acid ratios in these organs after ethanol treatment and these changes reveal opposite and robust metabolic response from the liver and pancreas as shown by fatty acid peak heights. For example, in liver tissue the increase in stearate (S) and decrease in desaturated fatty acids such as palmitoleate (PL), oleate (O) and linoleate (L) are apparent, while in the pancreas opposite changes are evident.