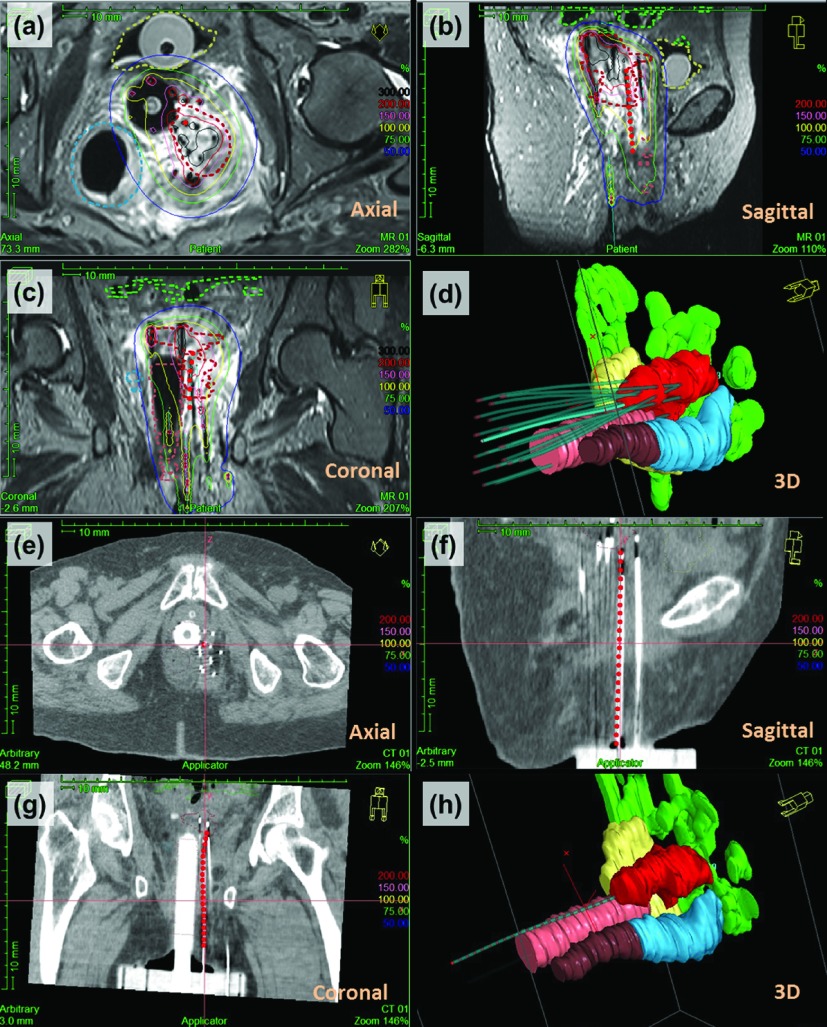
FIG. 5.
Catheter trajectory reconstruction on the treatment planning system (Oncentra, Elekta Bracytherapy, Stockholm, Sweden), using MRTR in a patient with recurrent endometrial cancer. [(a)–(c)] Screenshot of one MRTR-generated catheter trajectory (red dots) overlaid on the three orthogonal T2-weighted TSE MR images. Dose distribution is shown as isodose surfaces (solid lines). MRI-based contouring of the tumor and OARs is shown with dashed lines (red: tumor; yellow: bladder; blue: sigmoid; brown: rectum; green: bowel). (d) 3D view of catheter trajectories and geometric volumes representing the tumor and the OARs [organ color code is the same as in (a)–(c)]. The catheter trajectory acquired by MRTR is shown as a highlighted blue cylinder [same trajectory shown as red dots in (a)]. All the other catheters’ trajectories are from MRI-based digitization, shown in light blue color. [(e)–(g)] The MRTR generated catheter trajectory (red dot) overlaid on three orthogonal CT images, which was very consistent with the catheter location (bright signal) shown on CT. (h) 3D view of one catheter trajectory digitized from the CT images (light blue cylinder) and the same catheter trajectory extracted from MRTR (red dots).

