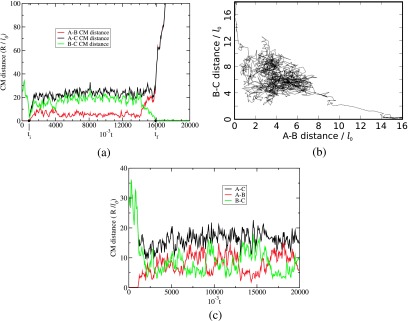
FIG. 6.
(a) Illustration of a typical successful substitution trajectory. The three CM distances among the three chains are plotted against time. A-B is the initial complex and B-C is the final complex. The substitution begins at ti and ends at tf. The substitution time τ is tf − ti. NA = 30, NB = 30, NC = 120, Γ = 2.8, L = 320l0, and no salt. (b) Reaction coordinate representation of substitution reaction for NA = 30, NB = 30, NC = 42, L = 320l0, Γ = 2.8, and no salt. (c) Illustration of a typical unsuccessful substitution trajectory. The three CM distances among the three chains are plotted against time. A-B is the initial complex and C is the invading chain. NA = 60, NB = 60, NC = 60, L = 320l0, Γ = 2.8, and no salt.

