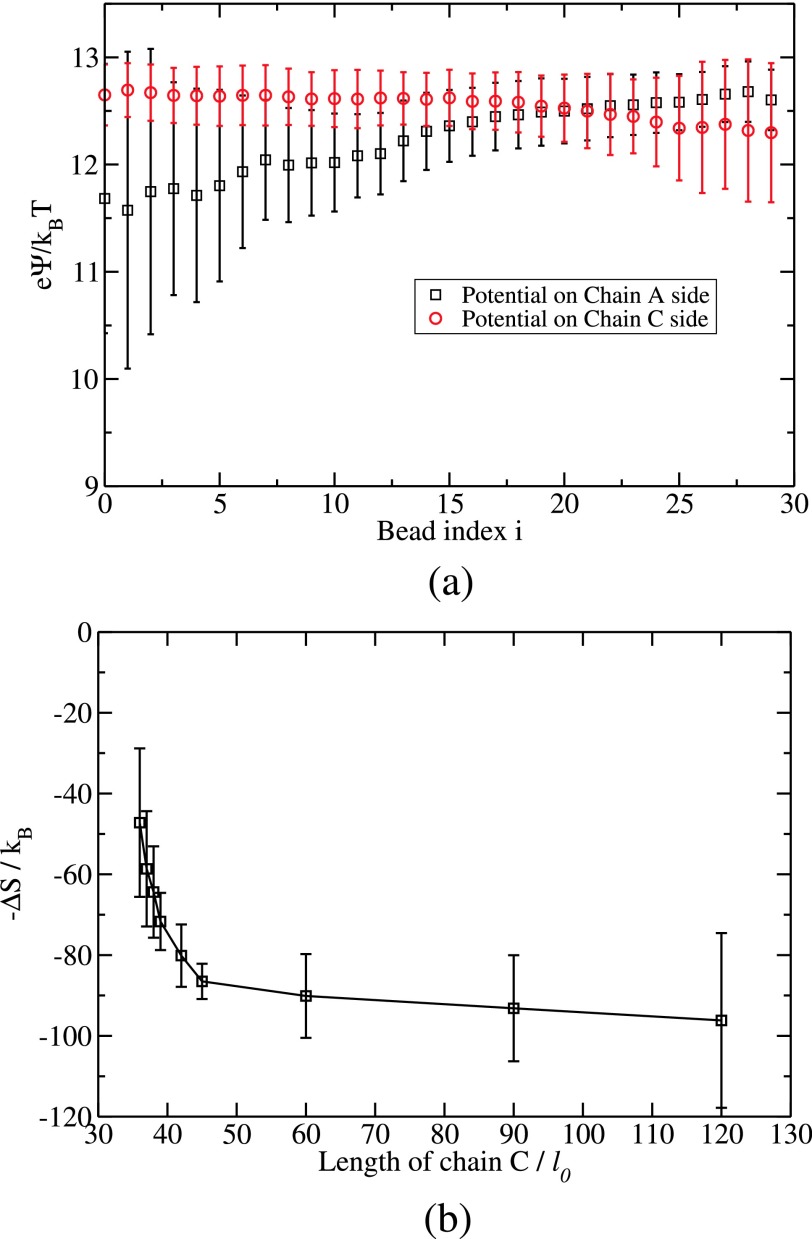
FIG. 9.
(a) Plot of local potential on the ith bead of B from chain A, ψA(i) (black square), and that from chain C, ψC(i) (red circle), versus bead index i. Electrostatics initiates the substitution, but does not finish it. (b) Free energy contribution from the translational entropy of released counterions versus the length of the invading chain.

