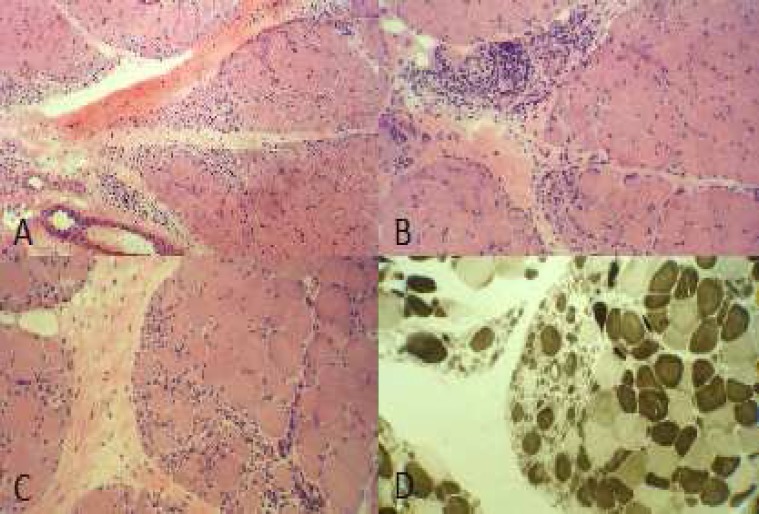
Figure 1.
(a) Prominent fiber size variation with atrophy and degeneration/regeneration of the fibers exclusively arranged in the periphery of the fascicles (H and E, ×40). (b) Perimysial perivascular infiltration of chronic inflammatory cells with perifascicular degenerative/regenerative fibers and increased internalized nuclei (H and E, ×200). (c) Group atrophy with the typical perifascicular pattern (H and E, ×200). (d) Checkerboard pattern with no fiber type grouping (ATPase PH 4.63, ×200)

