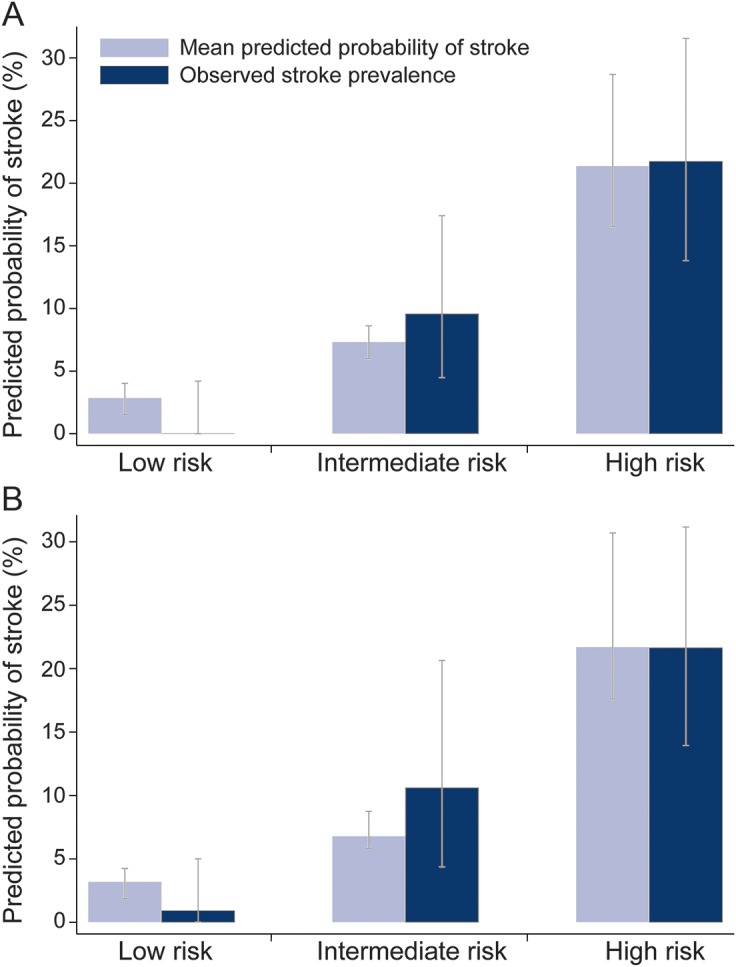
Figure 2. Model calibrations.

Calibration for model 1 (A) (including ocular motor 3-category scheme variable) and model 2 (B) (limiting the ocular motor examination to only the nystagmus component). Calibration was assessed using low, intermediate, and high predicted probability risk categories. Light blue bars represent the mean predicted probability of acute infarction or intracerebral hemorrhage (ICH) on MRI within each category. Dark blue bars represent the frequency of observed acute infarction or ICH on MRI within each category. Model 1 distribution of patients (stroke patients/total patients) within each category: low-risk category, 0/86; intermediate-risk category, 9/94; and high-risk category, 20/92. Model 2 distribution of patients (stroke patients/total patients) within each category: low-risk category, 1/109; intermediate-risk category, 7/66; and high-risk category, 21/97. Error bars represent 95% confidence intervals within each category calculated using the exact binomial method for observed stroke and 1,000 bootstrap samples for the predicted probability.
