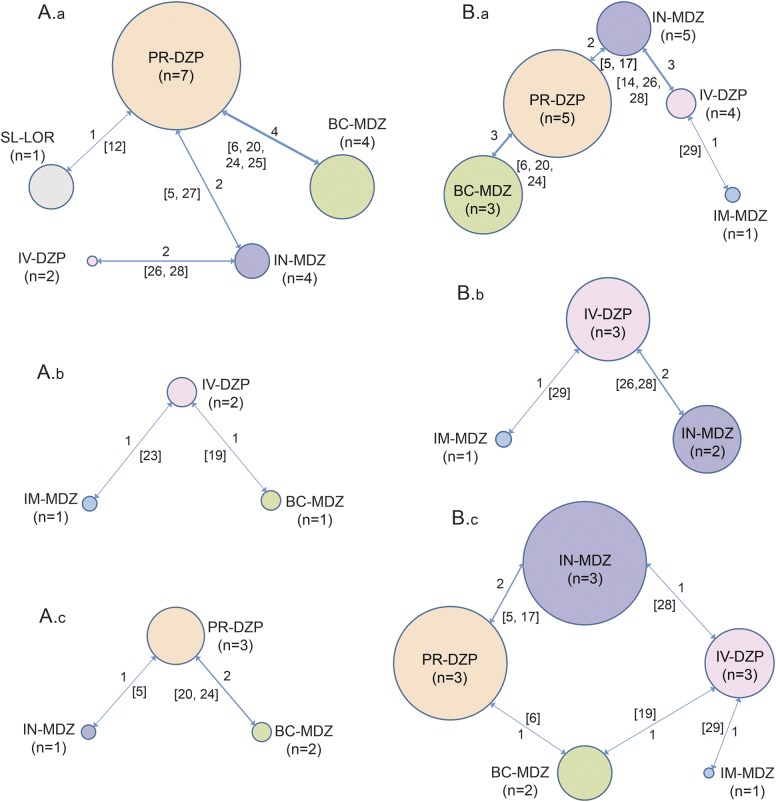
Figure 1. Bayesian network representations for individual outcomes.
The size of the bubble represents the total number of participants randomized to receive a particular route–drug combination. The number by the side of a line joining 2 bubbles indicates the number of trials for that particular comparison (A.a: seizure cessation within 10 minutes of drug administration, A.b: seizure cessation within 5 minutes of drug administration, A.c: persistent seizure cessation for at least 1 hour after drug administration, B.a: time from drug administration to termination of seizure [minutes], B.b: time to cessation of seizures after arrival in hospital [minutes], B.c: time to initiate treatment [minutes]) (reference numbers in square brackets). BC = buccal; DZP = diazepam; IM = intramuscular; IN = intranasal; LOR = lorazepam; MDZ = midazolam; PR = rectal; SL = sublingual.

