
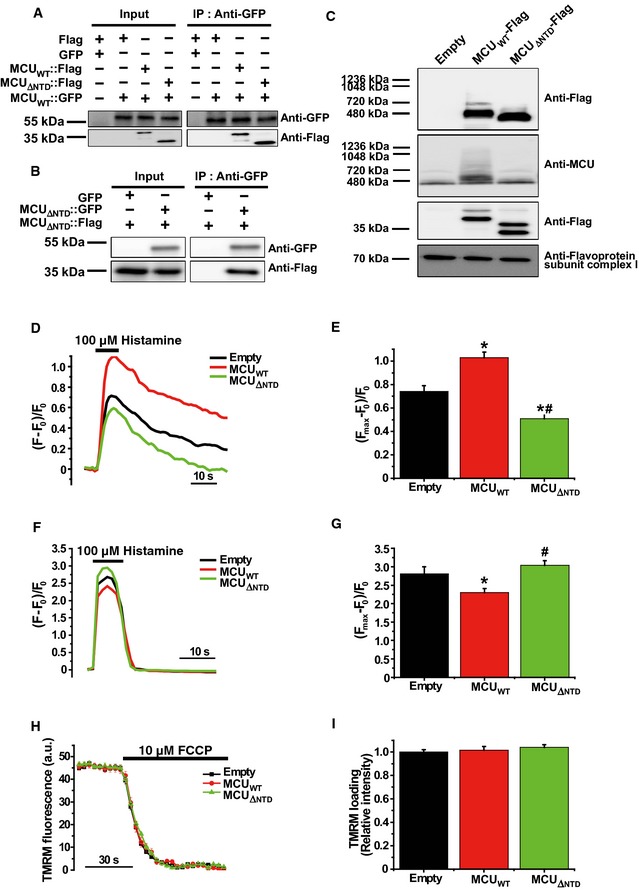
Figure 3. MCU Δ NTD overexpression has a dominant‐negative effect on mitochondrial Ca2+ uptake.
-
ACo‐immunoprecipitation of MCUWT‐Flag or MCU Δ NTD‐Flag with MCUWT‐GFP. HeLa cells were transiently co‐transfected with MCUWT‐GFP and MCUWT‐Flag/MCU Δ NTD‐Flag. MCU Δ NTD migrated farther than MCUWT, indicating an apparent molecular weight difference of 9 kDa in SDS–PAGE (see also Fig EV4A). MCUWT‐GFP with MCUWT‐Flag or MCU Δ NTD‐Flag was precipitated from the cell lysates with an anti‐GFP antibody. The precipitates were separated on SDS–PAGE and immunoblotted with the antibodies indicated.
-
BCo‐immunoprecipitation of MCU Δ NTD‐Flag with MCU Δ NTD‐GFP. HeLa cells were transiently co‐transfected with MCU Δ NTD‐Flag and MCU Δ NTD‐GFP. MCU Δ NTD‐GFP with MCU Δ NTD‐Flag was precipitated from cell lysates with an anti‐GFP antibody. The precipitates were separated on SDS–PAGE and immunoblotted with the indicated antibodies.
-
CHeLa cells were transiently transfected with MCUWT‐Flag or MCU Δ NTD‐Flag. After isolation and solubilization of crude mitochondria, the lysates were subjected to BN–PAGE and immunoblotted with anti‐Flag and anti‐MCU antibodies to detect ectopic MCUWT‐Flag, MCU Δ NTD‐Flag and endogenous MCU. MCUWT and MCU Δ NTD were detected at apparent molecular weights of 480 and 440 kDa, respectively. The shift shown in MCU Δ NTD complex correlated with the difference in molecular weight, if it is assumed to be a tetramer. Flavoprotein subunit of complex I is used as a loading control for each mitochondrial fraction.
-
D–GSimultaneous measurements of mitochondrial (D, E) and cytosolic (F, G) Ca2+ transients evoked by 100 μM histamine in HeLa cells overexpressing MCUWT or MCU Δ NTD. F0 is initial fluorescence intensity. F and Fmax indicate fluorescence intensity at each time point and maximal fluorescence intensity after the stimulation, respectively. (Fmax–F0)/F0 indicates the maximal Ca2+ concentration evoked by the stimulation (mean ± SEM, n = 12, *P < 0.05 versus empty vector‐transfected cells. # P < 0.05 versus MCUWT vector‐transfected cells). Unpaired two‐sided Student's t‐test was used to calculate statistical significance.
-
H, IThe mitochondrial membrane potential was monitored based on TMRM fluorescence intensity. After loading of TMRM, FCCP (carbonyl cyanide p‐trifluoro‐methoxyphenylhydrazone), an uncoupler of oxidation phosphorylation, was rapidly applied to disrupt the mitochondrial membrane potential established by the respiratory chain (ΔΨ). Fluorescence intensities of each group were recorded at each time point using a LSM 700 confocal laser‐scanning microscope. The value of TMRM loading (relative intensity) was calculated by dividing each fluorescence intensity of TMRM measured with MCUWT or MCU Δ NTD vector by that of TMRM measured with empty vector (mean ± SEM, n = 7).