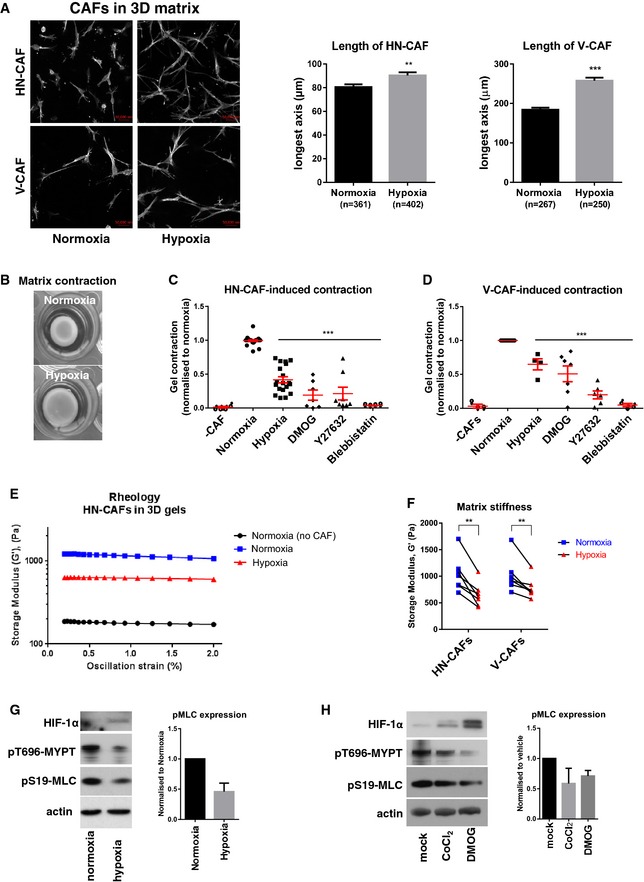
Figure 1. Hypoxia suppresses CAF‐induced matrix remodelling.

-
AF‐actin staining of human HN‐CAFs and V‐CAFs grown in 3D collagen I/Matrigels. The images are maximum projected for visualisation. Bars show quantification of the longest distance of HN‐CAFs grown in 3D collagen I/Matrigels, and of V‐CAFs plated on top of gels. Bars represent mean ± s.d. n = individual cells from three experimental repeats. **P < 0.01; ***P < 0.001; unpaired Student's t‐test (two‐tailed). Scale bar: 50 μm.
-
BCAF‐induced contraction assay. Images show HN‐CAF‐induced contraction of collagen I/Matrigels after 72 h of remodelling under normoxia and hypoxia.
-
C, DScatter plots show quantification of HN‐CAF (C)‐ and V‐CAF (D)‐induced contraction relative to normoxia. Each data point represents an independent experiment. Line and error bars indicate mean ± s.d. ***P < 0.001; one‐way ANOVA test.
-
E, FMatrix stiffness under normoxia and hypoxia. The storage modulus (G') of collagen I/Matrigels was measured by shear rheology after 72 h of CAF remodelling. CAFs were still alive within gels upon measurement. (E) Storage modulus was always measured over a decade of oscillation strain from 0.2 to 2%. (F) Scatter plot shows storage modules of matched experiments. Each couple of match data points represents an independent experiment. **P < 0.01; paired Student's t‐test (two‐tailed).
-
G, HImmunoblotting analyses of the contractile machinery in HN‐CAFs after 72 h under normoxia and hypoxia (G) and 72 h after treatment with hypoxia mimetic agents (H). Bars show quantification of mean ± s.d. phospho‐myosin light chain levels normalised to actin levels. n = 4 experimental repeats for hypoxia vs. normoxia. n = 2 experimental repeats for hypoxia mimetic agents.
