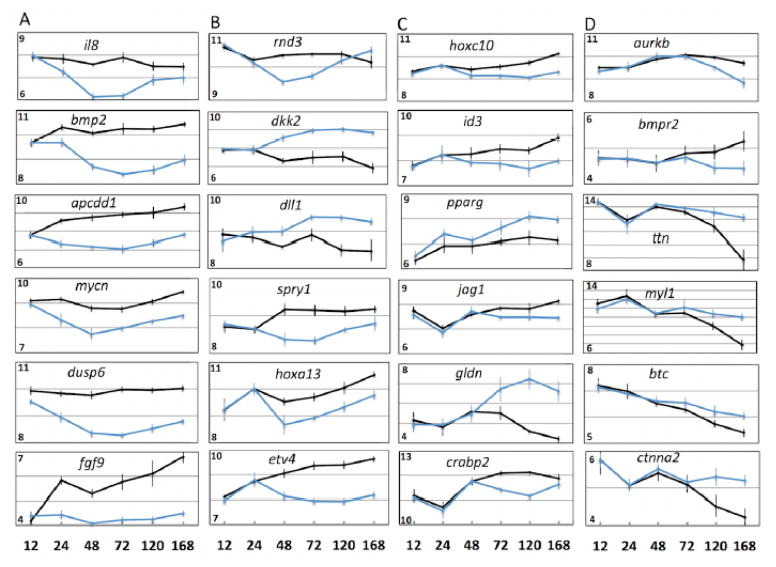
Figure 6. Expression profiles for genes that diverged significantly in expression between control and C59-treated embryos at 24 HPA (A), 48 HPA (B), 72 HPA (C), and 120 and168 HPA (D).
The numbers on the y-axes of each plot show the range of log (2) expression values. The error bars are standard deviations of the mean.

