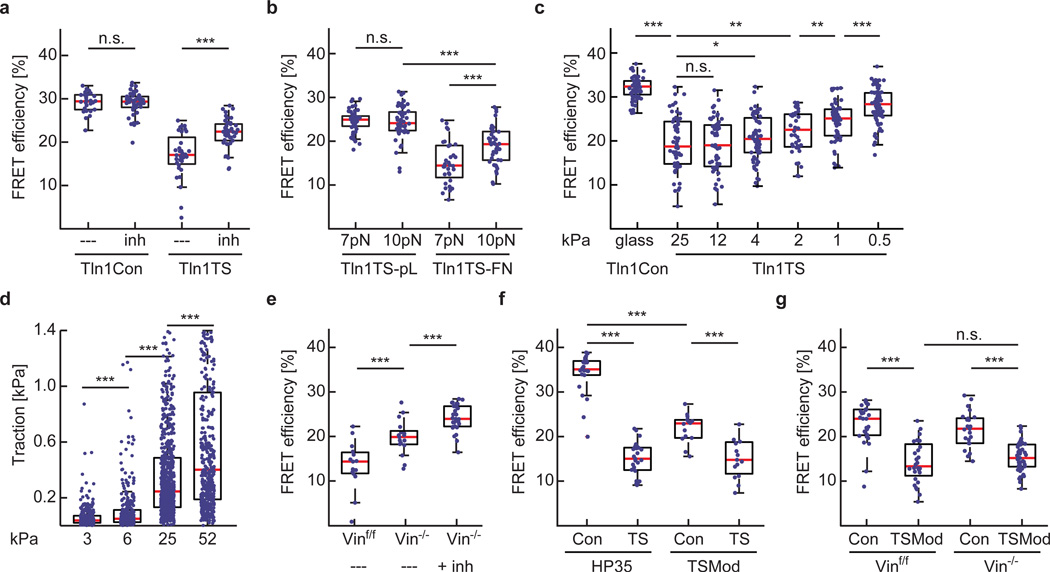
Figure 3.
Talin-1 mediates a constitutive mechanical linkage in FAs that is modulated by f-actin and vinculin association. (a) Treatment of cells with 10 µM Y-27632 (inh) induces an increase in average FRET efficiency specifically in Tln1TS cells (n=26, 42, 32 and 42 respectively from left to right; pooled from 3 independent experiments). (b) Comparing HP35-TS (7 pN) with HP35st-TS (10 pN)–based talin sensors in cells on FN- or pL-coated surfaces suggests that most talin-1 linkages experience force of more than 7 pN, some even more than 10 pN (n=52, 53, 32 and 40 cells respectively from left to right; 4 independent experiments). (c) FRET efficiencies in Tln1Con cells seeded on FN-coated glass coverslips (n=68) and in Tln1TS cells seeded on FN-coated 25 kPa (n=61), 12 kPa (n=58), 4 kPa (n=64), 2 kPa (n=40), 1 kPa (n=58) and 0.5 kPa (n=81) matrices; n represents the number of cells that were pooled from 5 independent experiments. (d) Rigidity-dependent traction force increase of Tln1Y cells seeded on FN-coated polyacrylamide gels with elastic moduli of 3.2 kPa (n=20), 6.3 kPa (n=16), 24.7 kPa (n=30) and 52 kPa (n=15); n represents the number of cells that were pooled from 3 independent experiments. Single data points represent traction forces from displacement of every hundredth bead. (e) Depletion of vinculin leads to an increase in FRET while treatment of Tln1TS-expressing Vin−/− cells with 10 µM Y-27632 further increases transfer rates indicating loss of vinculin leads to a reduction but not entire loss of talin tension (n=15, 17 and 29 cells respectively from left to right, pooled from 7 independent experiments). (f) The HP35-based sensor monitors talin-1 tension more efficiently than a biosensor using TSMod (n=22, 25, 14 and 15 cells respectively from left to right, 5 independent experiments). (g) TSMod does not properly resolve vinculin-dependent differences in talin-1 tension (n=29, 28, 25 and 41 cells respectively from left to right, 3 independent experiments). (a–c and e–g, Kolmogorov-Smirnov test; d, Wilcoxon–Mann–Whitney test. ***: p<0.001; **: p<0.01; *: p<0.05; not significant (n.s.): p > 0.05). Boxplots indicate the median (red line) as well as 25th and 75th percentiles; whiskers reach out to 2.7 standard deviations (σ). Statistic source data are available in Supplementary Table 1.

