Figure 4.
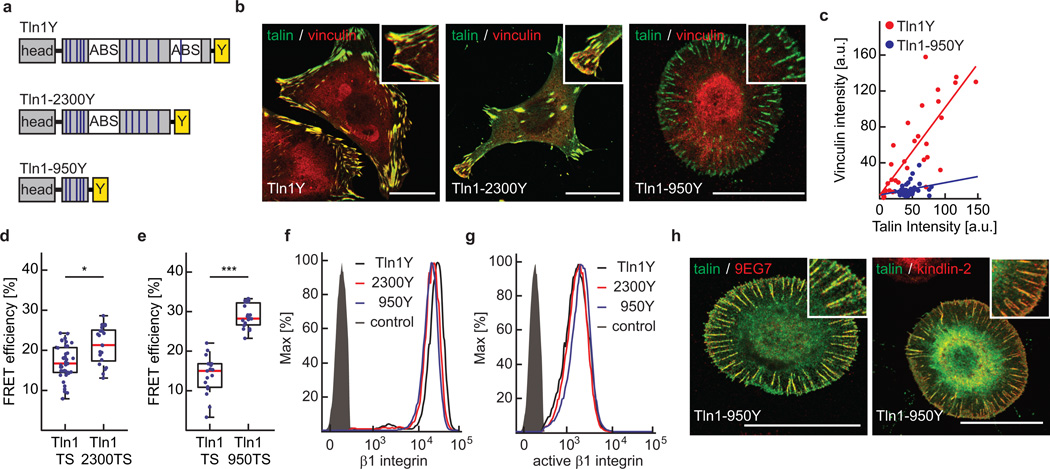
The talin-rod’s cytoskeletal engagement is essential for vinculin recruitment and talin tension but indispensable for integrin activation. (a) Schematic illustration of Tln1Y, Tln1-2300Y and Tln1950Y constructs; blue lines indicate VBS, white boxes ABS, yellow boxes the C-terminal YPet-tag. (b) Representative images from 3 independent experiments showing Tln1−/−Tln2−/− cells stably expressing Tln1Y, Tln1-2300Y and Tln1-950Y cells (green) stained with vinculin (red); scale bars, 20 µm. (c) Talin-1/vinculin FA co-localization analysis demonstrating the lack of vinculin recruitment to talin-positive adhesion sites in Tln1-950Y cells (n=32 (Tln1Y) and 33 (Tln1-950Y) FAs, pooled from 3 independent experiments). Pearson correlation coefficient (talin vs vinculin intensity): Tln1Y=0.8060, Tln1-950Y=0.2424. (d) Moderate reduction in talin-1 tension upon deletion of the dimerization domain and C-terminal ABS (Tln1-2300) (n=39 (Tln1TS) and 21 (Tln1-2300TS) cells, 4 independent experiments). (e) Loss of talin-1 tension in Tln1-950 cells (n=17 (Tln1TS) and 19 (Tln1-950TS), 4 independent experiments). (f, g) Representative FACS histograms of 4 independent experiments showing cells expressing Tln1Y (black), Tln1-2300Y (red) and Tln1950Y (blue) labelled for (f) beta1 integrin or (g) active beta1 integrin (9EG7); the negative control is shown in gray. Tln1950Y cells display normal integrin expression and activation. (h) Representative images from 3 independent experiments showing Tln1−/−Tln2−/− cells reconstituted with Tln1950Y (green) and labelled for active beta-1 integrin or kindlin-2 (red). The recruitment of kindlin-2 in Tln1950Y cells is consistent with normal integrin activation and cell adhesion; scale bars, 20 µm. (d, e, Kolmogorov-Smirnov test. ***: p<0.001; *: p<0.05). Boxplots indicate the median (red line) as well as 25th and 75th percentiles; whiskers reach out to 2.7 standard deviations (σ). Statistic source data are available in Supplementary Table 1.

