Figure 5.
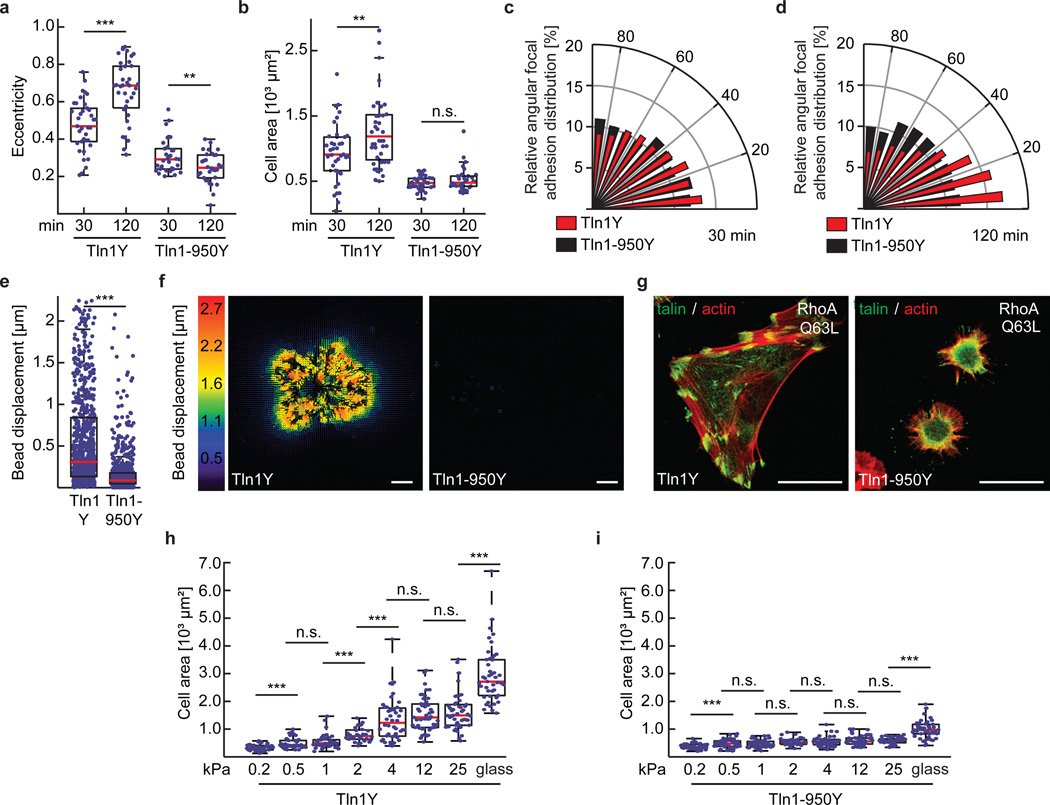
Cytoskeletal engagement of the talin-1 rod domain is indispensable for cell spreading, polarization, traction force generation and extracellular rigidity sensing. (a) Cellular eccentricity and (b) cell area of Tln1Y and Tln1-950Y cells after 30 min or 120 min of spreading on FN-coated glass coverslips; Tln1-950Y cells are unable to polarize and spread (in a and b: n=37, 36, 31 and 32 cells respectively from left to right, pooled from 3 independent experiments). (c, d) Relative angular FA distribution in Tln1Y cells (red) and Tln1950Y cells (black) after (c) 30 min and (d) 120 min of spreading on FN-coated glass coverslips indicating lack of polarization in Tln1950Y cells (in c and d: n=37 (Tln1Y 30 min), 36 (Tln1-950Y 30 min), 31 (Tln1Y 120 min) and 32 (Tln1-950Y 120 min) cells, 3 independent experiments). (e) Bead displacements observed under Tln1Y (n=21) and Tln1-950Y (n=22) cells cultured on 2 kPa polyacrylamide gels; data were pooled from 4 independent experiments. Tln1-950Y cells are characterized by significantly lower traction forces indicated by very small bead displacements. (f) Representative displacement images (4 independent experiments, corresponding quantification shown in e) of Tln1Y and Tln1-950Y cells indicating the virtual absence of traction forces in Tln1-950Y cells; scale bar, 10 µm. (g) Representative images from 3 independent experiments showing Tln1Y and Tln1-950Y cells (green) expressing active RhoAQ63L, stained for f-actin (red); Tln1-950Y cells fail to reinforce their FAs; scale bars, 20 µm. (h, i) Cell area of (h) Tln1Y and (i) Tln1-950Y cells after overnight culture on glass or FN-coated polyacrylamide gels with the indicated elastic moduli ranging from 0.2–25 kPa; Tln1Y (n=45, 45, 45, 32, 44, 47, 47 and 45 cells respectively from left to right, 3 independent experiments), Tln1-950Y (n=47, 49, 47, 32, 47, 46, 46 and 45 cells respectively from left to right, 3 independent experiments). Note that Tln1-950Y cells fail to distinguish rigidity differences. (a, b, h, i: two sided t-test; e, Wilcoxon–Mann–Whitney test. ***: p<0.001; **: p<0.01; *: p<0.05; not significant (n.s.): p > 0.05). Boxplots indicate the median (red line) as well as 25th and 75th percentiles; whiskers reach out to 2.7 standard deviations (σ). Statistic source data are available in Supplementary Table 1.

