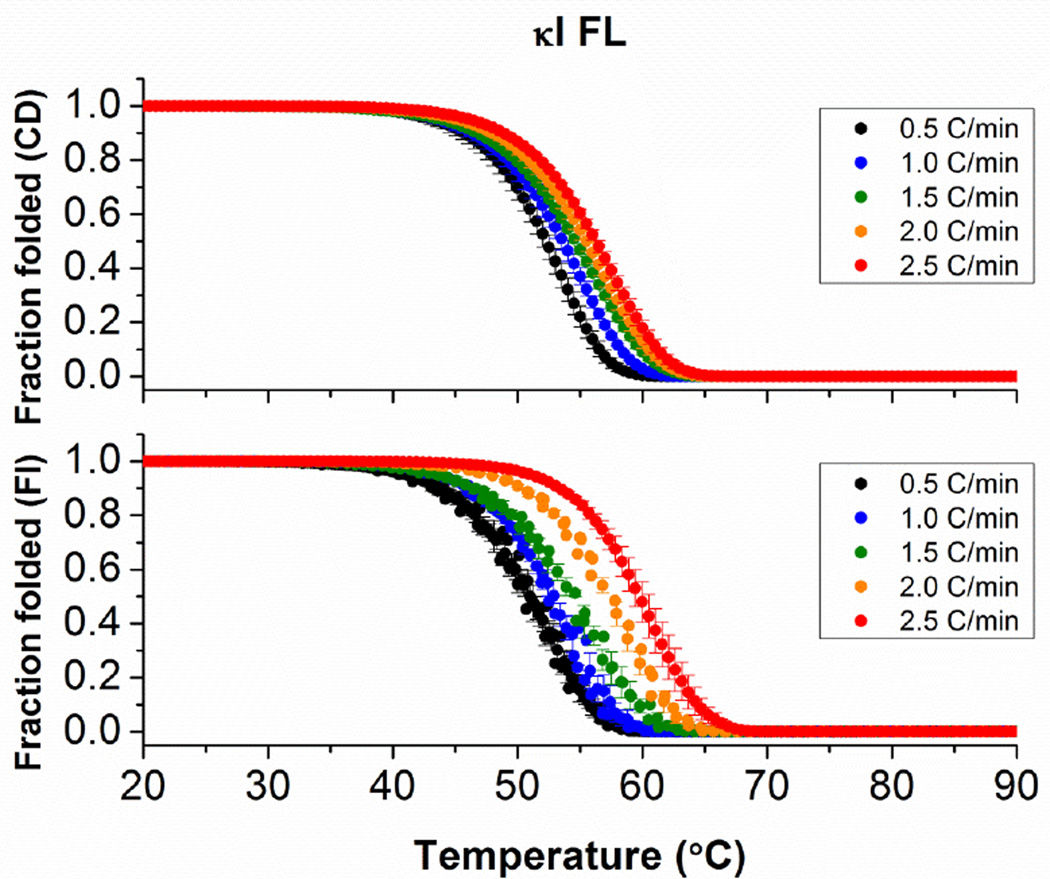
Figure 4.
Thermal stability analysis of κI FL following changes with (A) circular dichroism and (B) intrinsic fluorescence emission as a function of thermal scan rate. In all cases, melting curves were measured continuously from 4°C to 90°C every 0.5°C. Heating scan-rates employed are indicated in the figure. Samples were prepared at 2 µM and measured using a 1 cm cuvette and continuous stirring. Error bars correspond to the standard error obtained from 3 independent experiments.

