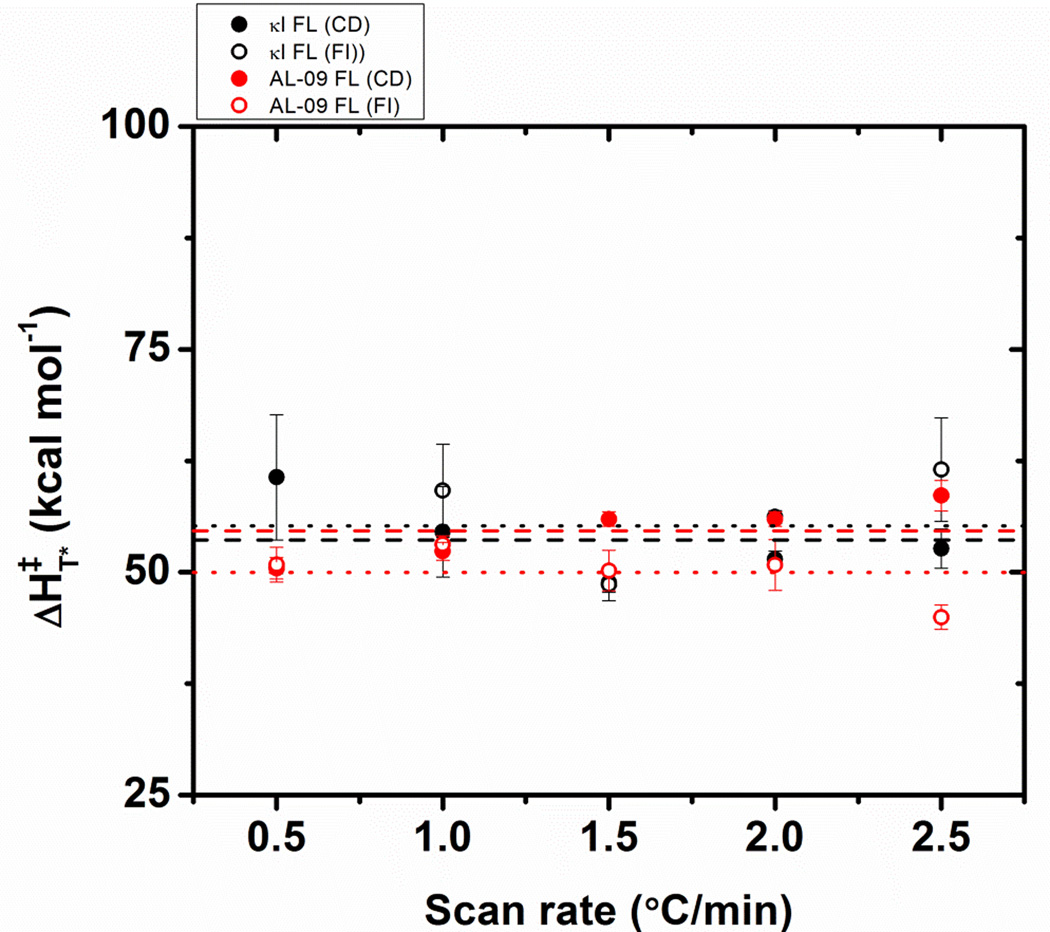
Figure 6.
Changes in the enthalpy reference independent of the applied scan rate ΔH‡, as a function of the scan rate. Lines are dashed for CD data and dotted for fluorescence data. Symbols are: κI FL (black); AL-09 FL (red). Data are the average of triplicates obtained from fitting each thermal unfolding transition using equation 4. Error bars correspond to the standard error obtained from 3 independent experiments.

