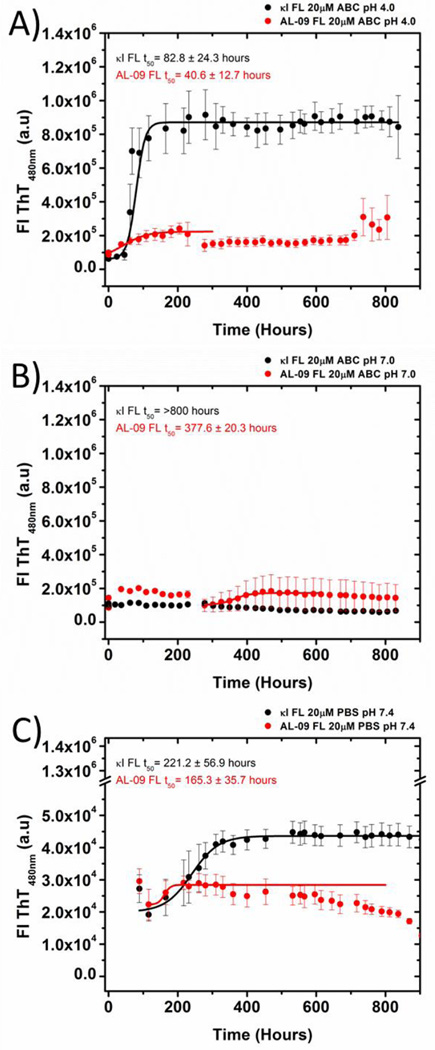
Figure 7.
Kinetics of fibril formation using (A) 10 mM (Acetate/Borate/Citrate) ABC buffer, pH 4.0,(B) 10 mM ABCbuffer, pH 7.0, (C) PBS buffer, pH 7.4. All traces are averages of three independent experiments. Solid lines represent fitting as reported before [13]. Data were collected for 800 hours. The last data points were not considered in the fitting due to the decrease in the ThT fluorescence observed attributed to inner filter effects. Error bars correspond to the standard error of the average of 3 independent experiments.

