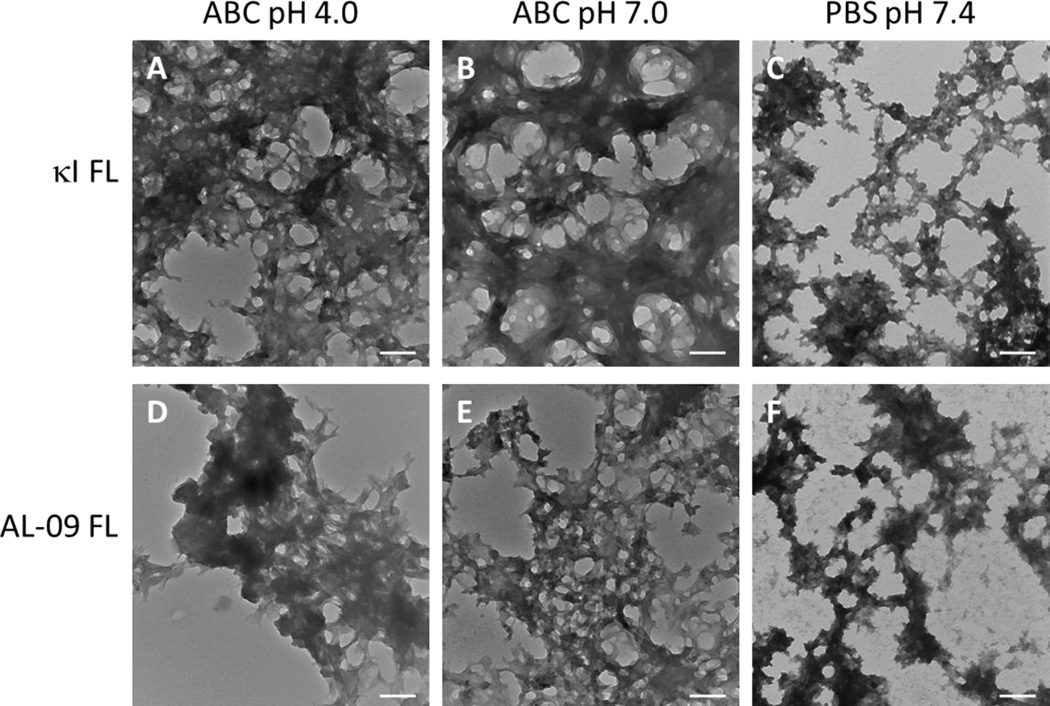
Figure 8.
TEM images of fibrils at the endpoint of the reaction. Comparison of the morphology of amyloid fibrils, at the end of the fibril reaction. κI FL in (A) Acetate/Borate/Citrate buffer pH 4.0, (B) ABC buffer pH 7.0, (C) PBS pH 7.4 and AL-09 FL in (D) ABC pH 4.0, (E) Acetate/Borate/Citrate buffer pH 7.0, and (F) PBS pH 7.4. Scale bar represent 200 nm.

