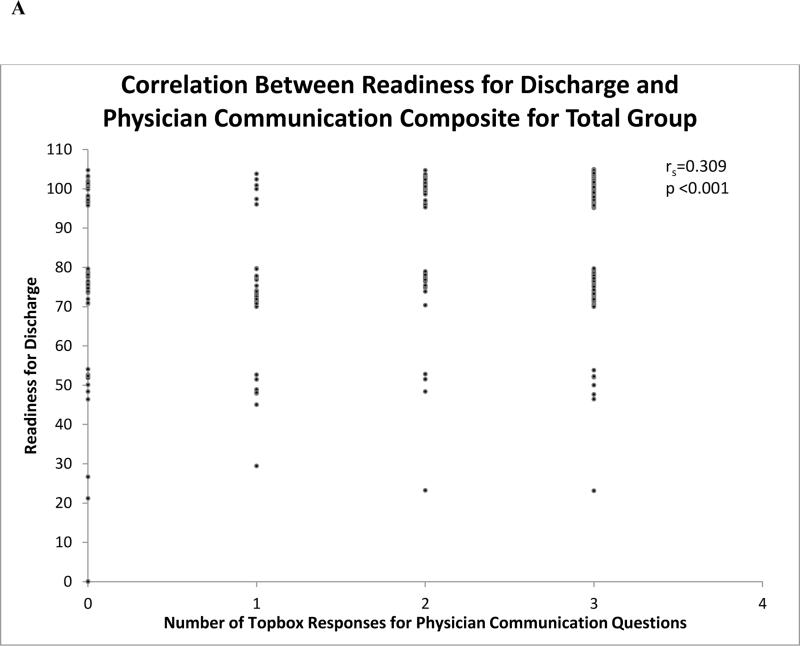
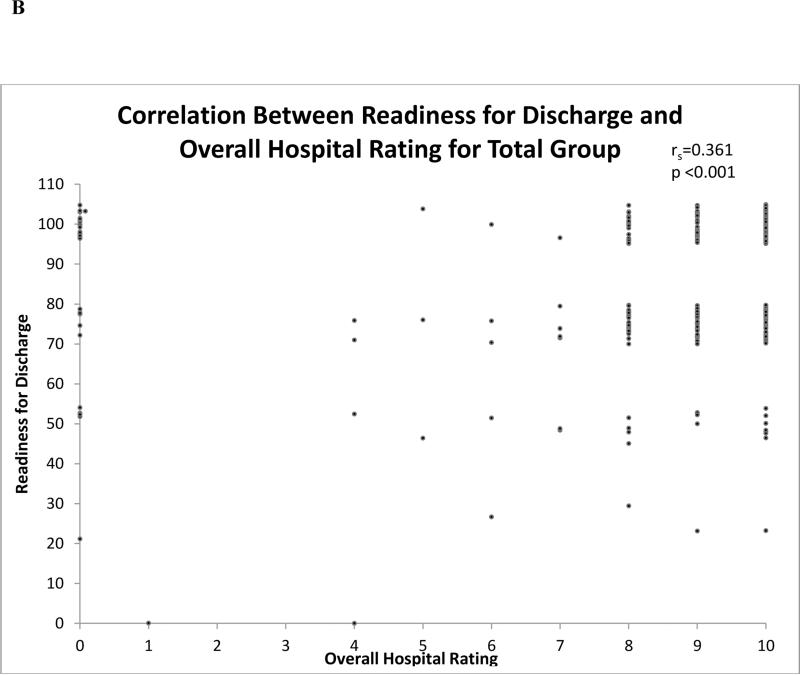
Figure 2.
Correlation between readiness for discharge and satisfaction measures for total group. (A) Plot of the total patient population; since many of the points overlapped secondary to the same responses to both questions, a very small random number was added or subtracted to the response to improve the visual depiction of the data. The values y-axis represents the actual patient response to the readiness for discharge question. The value on the x-axis represents the number of topbox responses to the physician communication composite questions. (B) Plot of the total patient population; since many of the points overlapped secondary to the same responses to both questions, a very small random number was added or subtracted to the response to improve the visual depiction of the data. The values y-axis represents the actual patient response to the readiness for discharge question. The value on the x-axis represents the response to the overall hospital rating question.


