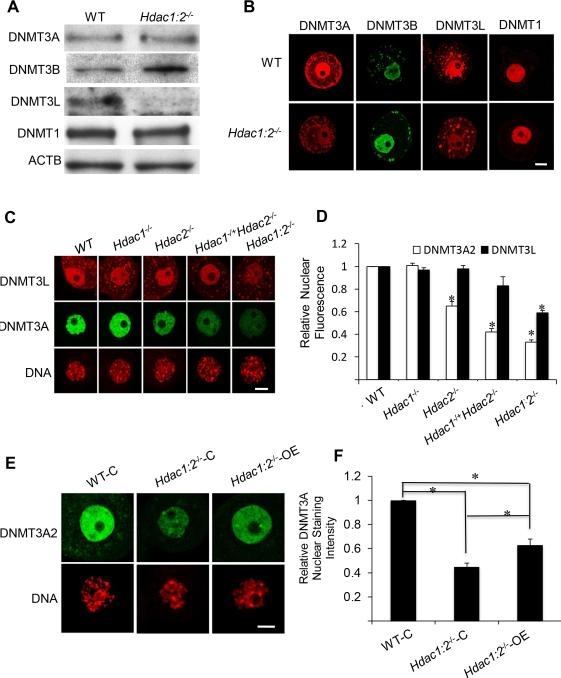
Figure 4. Expression of DNMT1, DNMT3A, DNMT3B and DNMT3L in Hdac1:2−/− oocytes and expressing Hdac2 in Hdac1:2−/− growing oocytes partially restores DNMT3A2 nuclear stainning.
(A) Relative amount of DNMT1, DNMT3A, DNMT3B and DNMT3L determined by immunoblot analysis. Extracts for immunoblot analysis were prepared from oocytes obtained from at least four WT or mutant mice 12 days-of-age and total protein extract equivalent to 150 oocytes was loaded per lane. The experiment was conducted 3 times, and similar results were obtained in each case. ACTB was used as a loading control. (B) Immunocytochemical detection of DNMT31, DNMT3A, DNMT3B and DNMT3L in WT and mutant oocytes obtained from mice 12-days-of-age. Shown are representative images and only the nucleus is shown. (C) Immunocytochemical detection of DNMT3A in oocytes obtained from mice 12-days-of-age and lacking different combinations of Hdac1 and Hdac2. Shown are representative images and only the nucleus is shown. DNA was counterstained with propidium iodide. (D) Quantification of the data shown in C in which the nuclear staining intensity of DNMT3A in WT oocytes was set to 1. All data are expressed as mean ± SEM. *, p < 0.05. (E) Mutant oocytes were injected with either a cRNA (0.4 μg/μl) encoding Hdac2 (Hdac1:2−/−-OE) or MiliQ water (Hdac1:2−/−-C) and incubated in CZB medium; controls were wild-type oocytes (WT-C). Oocytes were removed 30 h after injection for immunoctyochemical detection of DNMT3A. Shown are representative images. DNA was counterstained with propidium iodide. (F) Quantification of the data shown in panel A. Staining intensity of DNMT3A2 in WT oocytes was set to 1 and the data are expressed as mean ± SEM. Signal intensities relative to WT in Hdac1:2−/−-C and Hdac1:2−/−-OE are 45±4%, and 63±6% respectively. *, p< 0.02.

