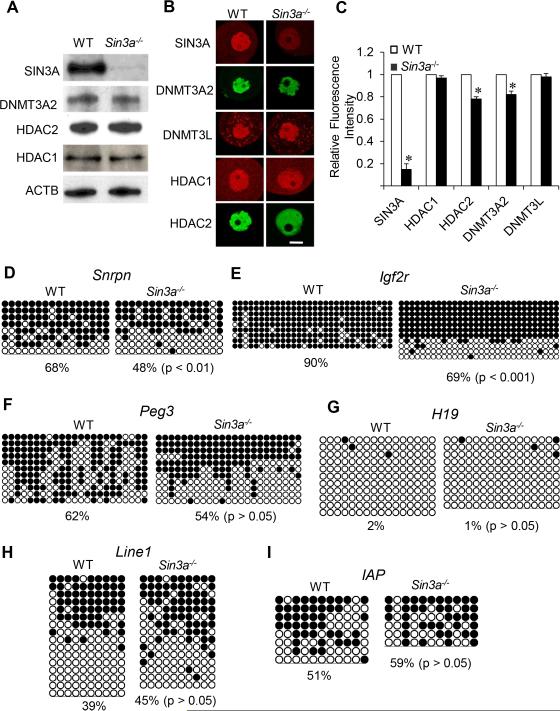
Figure 5. Expression of HDAC1, HDAC2 and DNMT3A2 and DNA methylation in Sin3a−/− Oocytes.
(A) Relative amount of SIN3A, HDAC1, HDAC2 and DNMT3A2 was determined by immunoblot analysis by using total protein extracts from WT and Hdac1:2−/− growing oocytes obtained from mice 12 days-of-age. Equal numbers (200) of oocytes were loaded per lane and and beta-actin (ACTB) was used as a loading control. The experiment was conducted 2 times, and similar results were obtained in each case. (B) Immunocytochemical detection of SIN3A, HDAC1, HDAC2 and DNMT3A2 in WT and Sin3a−/− oocytes obtained from mice 12-days-of-age. Shown are representative images and only the nucleus is shown. (C) Quantification of the data of HDAC2 and DNMT3A2 imunostaining shown in panel B. Nuclear staining intensity of HDAC2 and DNMT3A2 in WT oocytes was set to 1, and the data are expressed as mean ± SEM. Bisulfite sequencing analysis of DNA methylation at the ICRs of maternally methylated genes, Snrpn (D), Igf2r (E), Peg3 (F) or H19 (G) that is a paternally methylated gene, and repetitive elements, LINE1 (H) and IAP (I) in WT and Sin3a−/− growing oocytes obtained from mice 12 days-of-age. Filled circles represent methylated sites and open circles represent unmethylated sites. Each row represents data from a single DNA molecule. The numbers below each set of DNA strands indicate the percent of methylated CpG sites.

