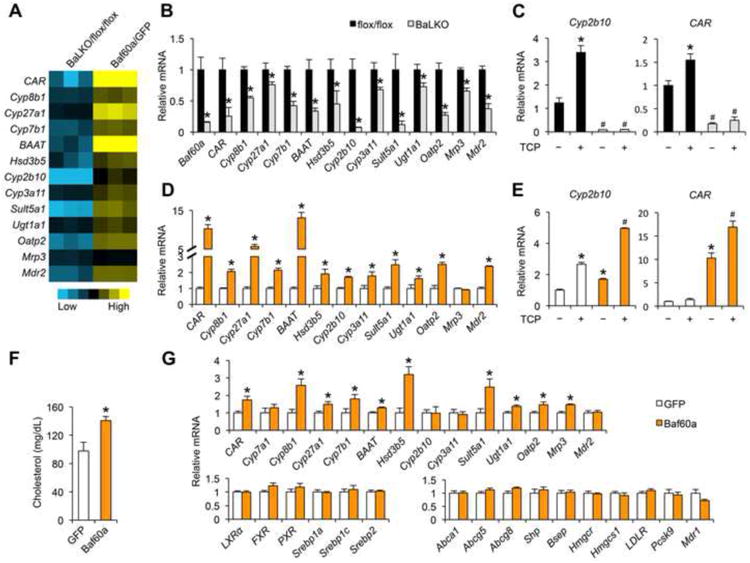
Figure 4. Baf60a regulates the bile acid metabolism gene program in a cell-autonomous manner.

(A) Heat map representation of gene regulation in response to Baf60a deficiency (BaLKO/flox/flox) and Baf60a overexpression (Baf60a/GFP) in primary hepatocytes.
(B-C) qPCR analysis of gene expression in primary hepatocytes isolated from flox/flox and BaLKO mice in the presence or absence of TCPOBOP treatment (TCP, 1 μM) for 24 h. In c, *P < 0.05 vs. vehicle treatment alone (the first bar); #P < 0.05 vs. TCP treatment alone (the second bar).
(D-E) qPCR analysis of gene expression in primary hepatocytes transduced with GFP or Baf60a adenoviruses and treated with or without TCP 1 μM for 24 h. *P < 0.05 vs. GFP expression alone; #P < 0.05 vs. TCP treatment or Baf60a expression alone.
(F) Plasma cholesterol levels in WD-fed WT mice transduced with adenovirusesexpressing GFP or Baf60a.
(G) qPCR analysis of hepatic gene expression in WT mice transduced withadenoviruses expressing GFP or Baf60a. Data in B-E represent mean ± s.d. andare representative of three independent experiments; Data in F and G representmean ± s.e.m. (n = 6); #P < 0.05, and *P < 0.05 by two-tailed Student's t-test.
