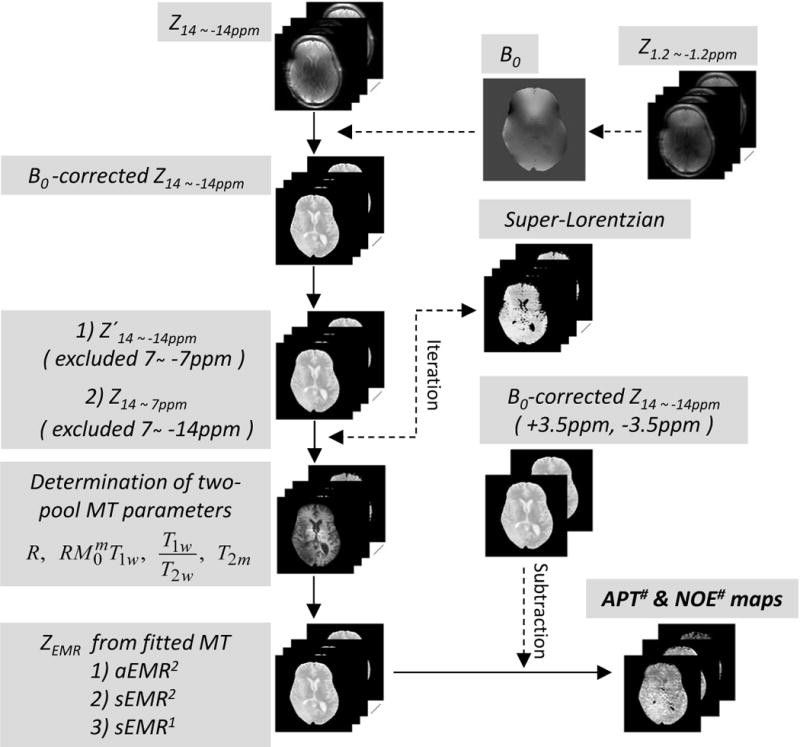
Figure 1.

Flow chart of data processing procedures for APT# and NOE#. After B0 corrections with WASSR, the wide-offset dataset, Z′14 ~ −14ppm or Z14 ~ 7ppm, was fitted to the two-pool MT model with a super-Lorentzian lineshape, and R, T2m, , and T1w/T2w and Δmw (for aEMR2) were determined from the MT fitting routine. By subtracting experimental data (Z14 ~ −14ppm) from fitted EMR data, APT# and NOE# signals could be obtained.
