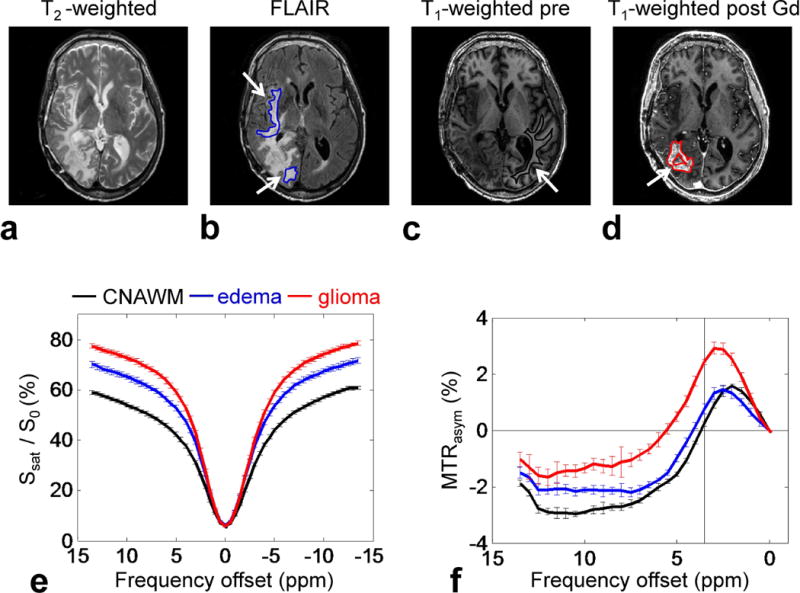
Figure 2.

ROI analysis results from seven patients. a–d: Example of ROIs on conventional MR images for a patient with a glioblastoma (edema, blue; CNAWM, black; glioma, red). e–f: Average Z-spectra and MTRasym spectra for the CNAWM (black), edema (blue), and glioma (red).
