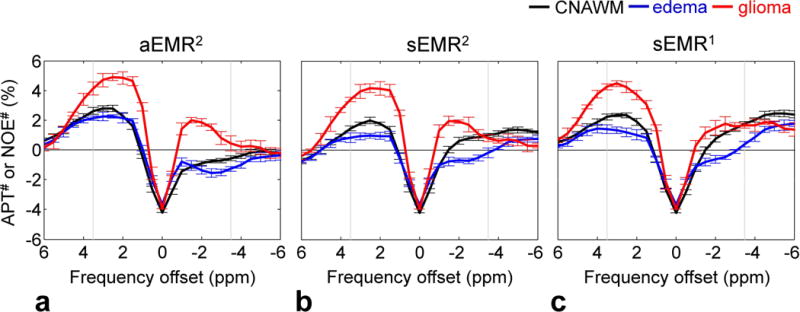
Figure 5.

Downfield APT# and upfield NOE# signal features as a function of frequency offsets obtained with the aEMR2 (a), sEMR2 (b), and sEMR1 (c) models from the CNAWM (black), the edema (blue), and the glioma (red) from 11 patients. The results were obtained by subtracting the experimental Z-spectra (gray asterisks in Fig. 3) from the corresponding EMR spectra (solid lines in Fig. 3).
