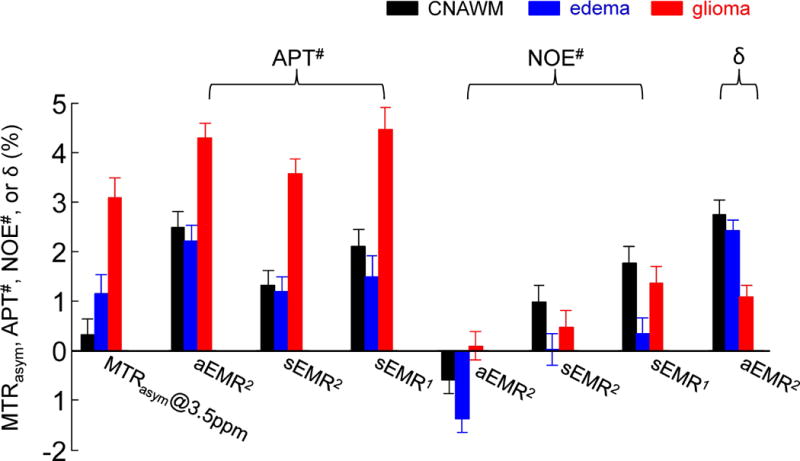
Figure 6.

Average MTRasym (3.5ppm), APT#, NOE#, and δ (for aEMR2 only) signal intensities obtained with three EMR models from the CNAWM, edema, and glioma from 11 patients. APT# = ZEMR (+3.5ppm) − Z(+3.5ppm); NOE# = ZEMR (−3.5ppm) − Z(−3.5ppm); δ = ZEMR (3.5ppm) − ZEMR (−3.5ppm), for aEMR2 only. Error bars depict standard errors. Calculated APT# signal intensities of glioma (~4%) were much larger than the values reported previously (7).
