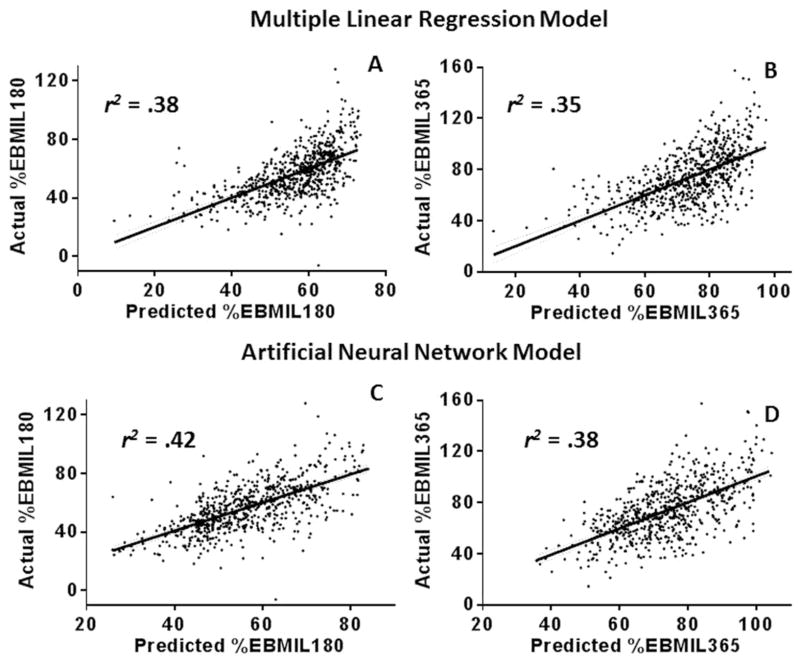
Figure 3.
Actual vs. predicted EBMIL plots for both models, at 180 and 365 days postoperatively
A- Plot of actual vs. multiple linear regression-predicted EBMIL180; r2 = .38, root-mean-square error (RMSE) = 13.0. B- Plot of actual vs. multiple linear regression-predicted EBMIL365; r2 = .35, RMSE = 17.4. C- Plot of actual vs. artificial neural network-predicted EBMIL180; r2 = 0.42, root-mean-square error (RMSE) = 12.6. D- Plot of actual vs. artificial neural network-predicted EBMIL365; r2 = .38, RMSE = 16.9. Linear regression lines with 95% confidence bands are included on all plots (dashed lines).

