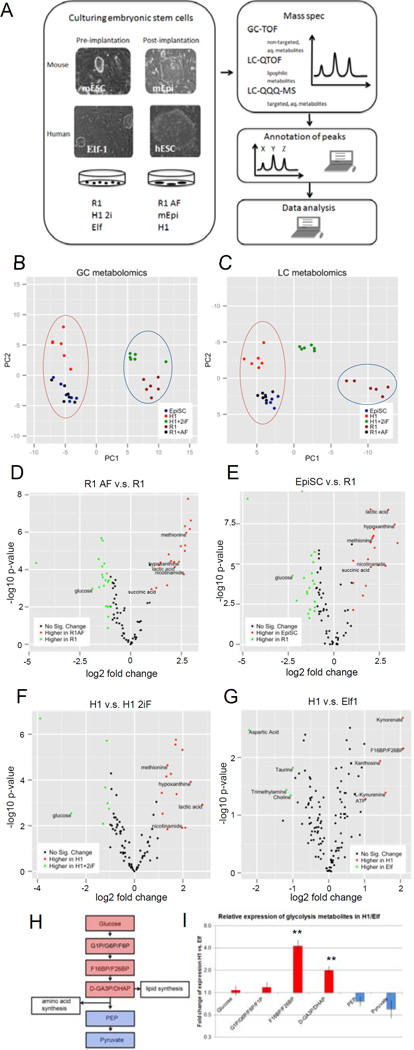
Figure 2. Metabolomic analysis of naïve and primed ESCs.
A: Scheme of mass spectrometry experiments performed for metabolites on mouse and human naïve (pre-implantation) and primed (post-implantation) ESCs. B-C: naïve and primed stem cells can be clearly separated based on their metabolic profiles. (B) PCA plot of water-soluble untargeted GC-MS metabolomics data. The first principal component (PC), which separates the primed cell types (left) from the naïve cell types (right) explained 50.5% of total variance. (C) PCA plot of untargeted LC metabolomics data. 3 clusters are along the first PC: primed cells (left), primed cells toggled back to naïve cells (middle) and naïve cells (right). The first PC explained 68.2% of total variance. D–G: volcano plots of differentially abundant metabolites between primed and naïve cells in mESCs (D, E) detected by GC-TOF, and hESCs (F: GC-TOF, G: LC-QQQ-MS). x-axis is log2 fold change of abundance, y-axis is negative log10 of p-value. Metabolites of biological interest for further analysis are labeled. H: Visualization of the glycolysis pathway and connections to lipid and amino acid synthesis. I: Fold change of glycolysis metabolites (n=3, s.e.m.; Glucose (p=0.6630), G1P-G6P-F6P-F1P (p=0.3713), F16BP-F26BP (p=0.0070), D-GA3P-DHAP (p=0.0058), PEP (p=0.1925), Pyruvate (p=0.1416); 2-tailed t-test) after log2 transformation and mean centering in H1 vs. Elf1 detected by targeted LC-QQQ-MS. For raw data, see Supplementary Tables 1 and 4. n=number of biological replicates.

