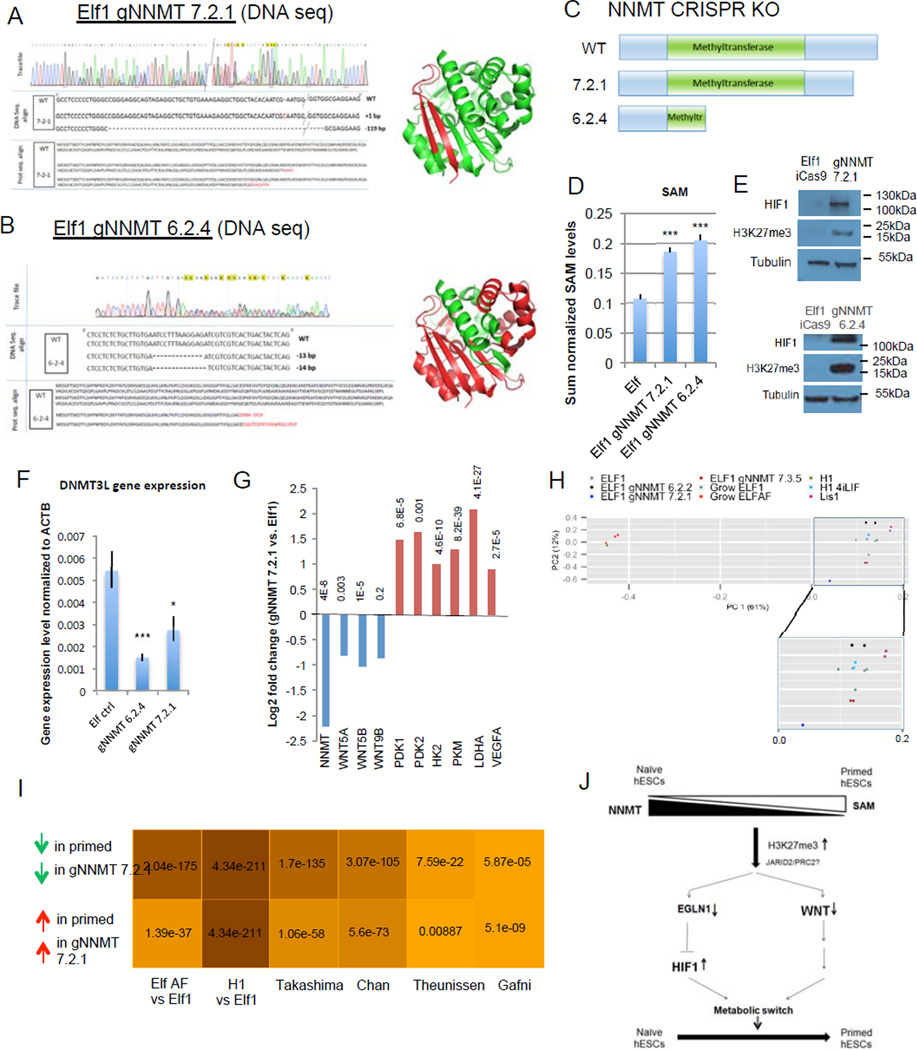
Figure 8. NNMT affects naïve to primed hESC transition by repressing Wnt pathway and activating HIF pathway.
A–B: Sequencing trace files, DNA sequences, protein sequences and 3D protein structures predicted from sequence (Pymol) of various NNMT CRISPR-Cas9 KO mutant clones (gNNMT 7.2.1, A; gNNMT 6.2.4, B). Green color represents the truncated NNMT protein in the CRISPR-Cas9 mutant. C: Schematic representation of wild type NNMT protein and proteins resulting from the CRISPR-Cas9 KO mutants gNNMT 7.2.1 and gNNMT 6.2.4. D: Elf1 NNMT CRISPR-Cas9 KO cells have higher amounts of SAM than wild type Elf1 cells (n=6; s.e.m.; p=1.23E-05 for gNNMT7.2.1, p=5.47E-06 for gNNMT6.2.4; 2-tailed t-test). E: Western blot analysis reveals higher HIF1α expression and H3K27me3 marks in Elf1 CRISPR-Cas9 KO mutants gNNMT 7.2.1 and gNNMT 6.2.4 compared to control Elf1 (iCas9) cells. F: qPCR analysis of the naïve marker DNMT3L in wild type Elf1 cells (n=6) and Elf1 CRISPR-Cas9 KO mutants gNNMT 7.2.1 (n=5) and gNNMT 6.2.4 (n=3). s.e.m.; p=0.0009 for gNNMT 6.2.4 vs. Elf1, p=0.027 for gNNMT 7.2.1 vs. Elf1; 2-tailed t-test. G: log2 fold expression change of NNMT, WNT ligands and HIF target genes in Elf1 CRISPR-Cas9 KO gNNMT 7.2.1 compared to wild type Elf1 cells (RNAseq). H: PCA plot of CRISPR NNMT knockout line and different naïve and primed lines sequenced in this study. gNNMT 6.2.2 and gNNM 7.3.5 are heterozogous controls. PC1 (x-axis) explains majority of the variation in the data (61%), and the gNNMT 7.2.1 knockdown line moved along x-axis substiantially away from other naïve lines and toward the primed state. I: Hypergeometric test p-values for the overlap between genes expressed higher (lower) in gNNMT 7.2.1 compared to Elf1 and genes expressed higher (lower) in primed lines compared to naïve lines from multiple studies. Color shade is proportional to negative log10 of p-values. gNNMT 7.2.1 transcriptomic signature has significant overlap with all published primed transcriptomic datasets, supporting its transition toward a primed stage. J: Model of the intricate relationship between metabolism and epigenetic in hESCs. Unprocessed original scans of blots are shown in Supplementary Fig.9. For raw data, see Supplementary Table 4. n= number of biological replicates.

