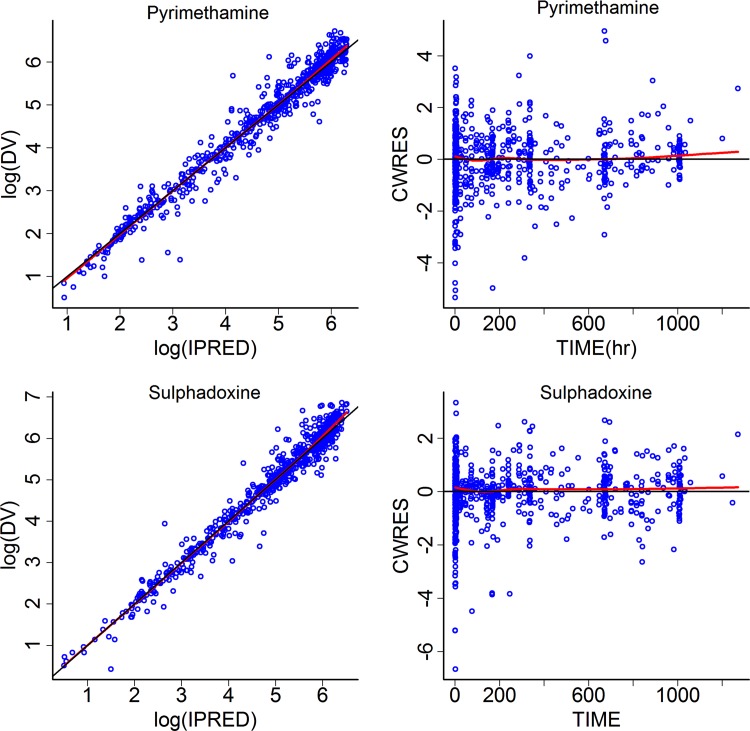
Fig. 2.
Plots of observed concentrations (DV) versus individual predictions (IPRED) (left panels) and conditional weighted residuals (CWRES) versus time (right panels) for pyrimethamine (upper panels) and sulphadoxine (lower panels). The red lines show the trends of the data, and the black lines indicate the expected trends. The blue circles represent observed data, and darker coloring of the circles indicates overlapping observations

