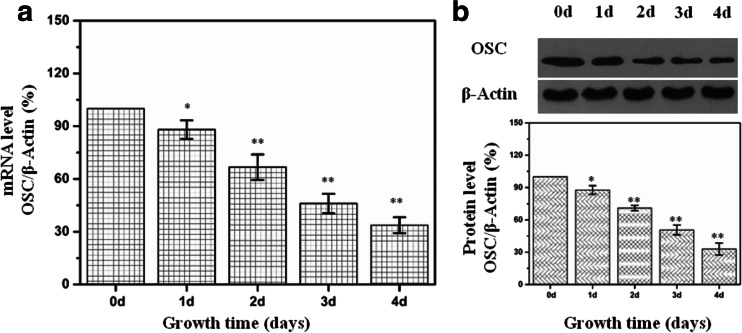
Fig. 3.
Expression of OSC in HL-02 cells treated with IH (cycle of 2 % O2 5 min and 21 % O2 10 min) for different times. a mRNA levels of OSC expression in HL-02 cells were determined with real-time quantitative RT-PCR in an IH treatment time course study. b Protein levels of OSC expression in HL-02 cells were determined by Western blot after IH treatment. *p < 0.05, **p < 0.01 vs the cells grown under normoxic conditions

