
Figure 4.
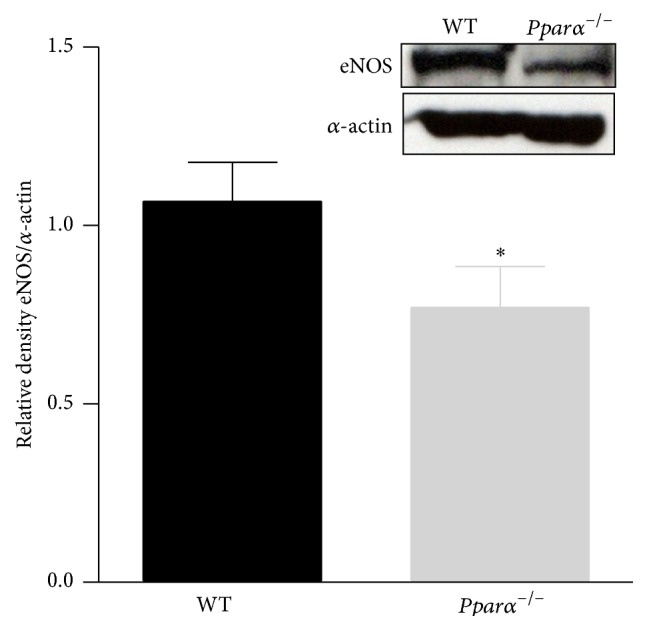
Decreased expression of eNOS in Pparα −/− mice. Western blot data showing the expression level of eNOS in aorta of Pparα −/− and WT mice. ∗ denotes statistical significance from WT mice (p < 0.05; n = 3 animals). Data are means ± SEM.
Official websites use .gov
A
.gov website belongs to an official
government organization in the United States.
Secure .gov websites use HTTPS
A lock (
) or https:// means you've safely
connected to the .gov website. Share sensitive
information only on official, secure websites.
Decreased expression of eNOS in Pparα −/− mice. Western blot data showing the expression level of eNOS in aorta of Pparα −/− and WT mice. ∗ denotes statistical significance from WT mice (p < 0.05; n = 3 animals). Data are means ± SEM.