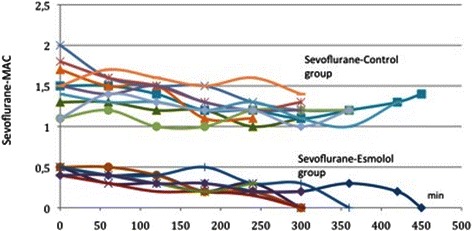
Fig. 1.

Intraoperative fluctuations of propofol in the control (top of the picture) and the esmolol group (bottom of the picture). Each patient is indicated with a different color. Initial infusion rate of propofol is higher in the control group compared to the esmolol group. Also, infusion rate of propofol at each time point was much lower for the esmolol group than for the control group. Mean value of propofol in control group was 134 ± 12.9mcg/Kg/min, where in the esmolol group was 25.83 ± 9.32 mcg/kg/min during the procedure
