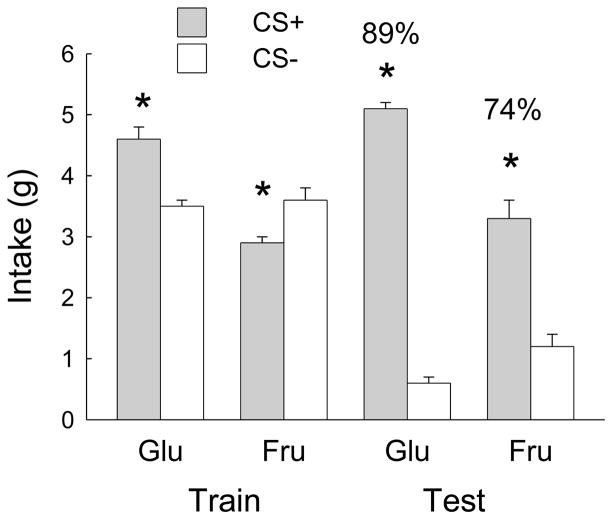
Fig. 7.
Experiment 3B. Mean intakes (oral + IG) during 1-bottle training and 2-bottle tests for the Fructose and Glucose groups in the conditioned flavor preference procedure. The CS+ and CS- were paired with IG 16% sugar and water infusions, respectively. Numbers atop bars indicate percent CS+ intake, relative to total intake during 2-bottle test. Significant differences (p < 0.05) between CS+ and CS- intakes are indicated by asterisks.

